
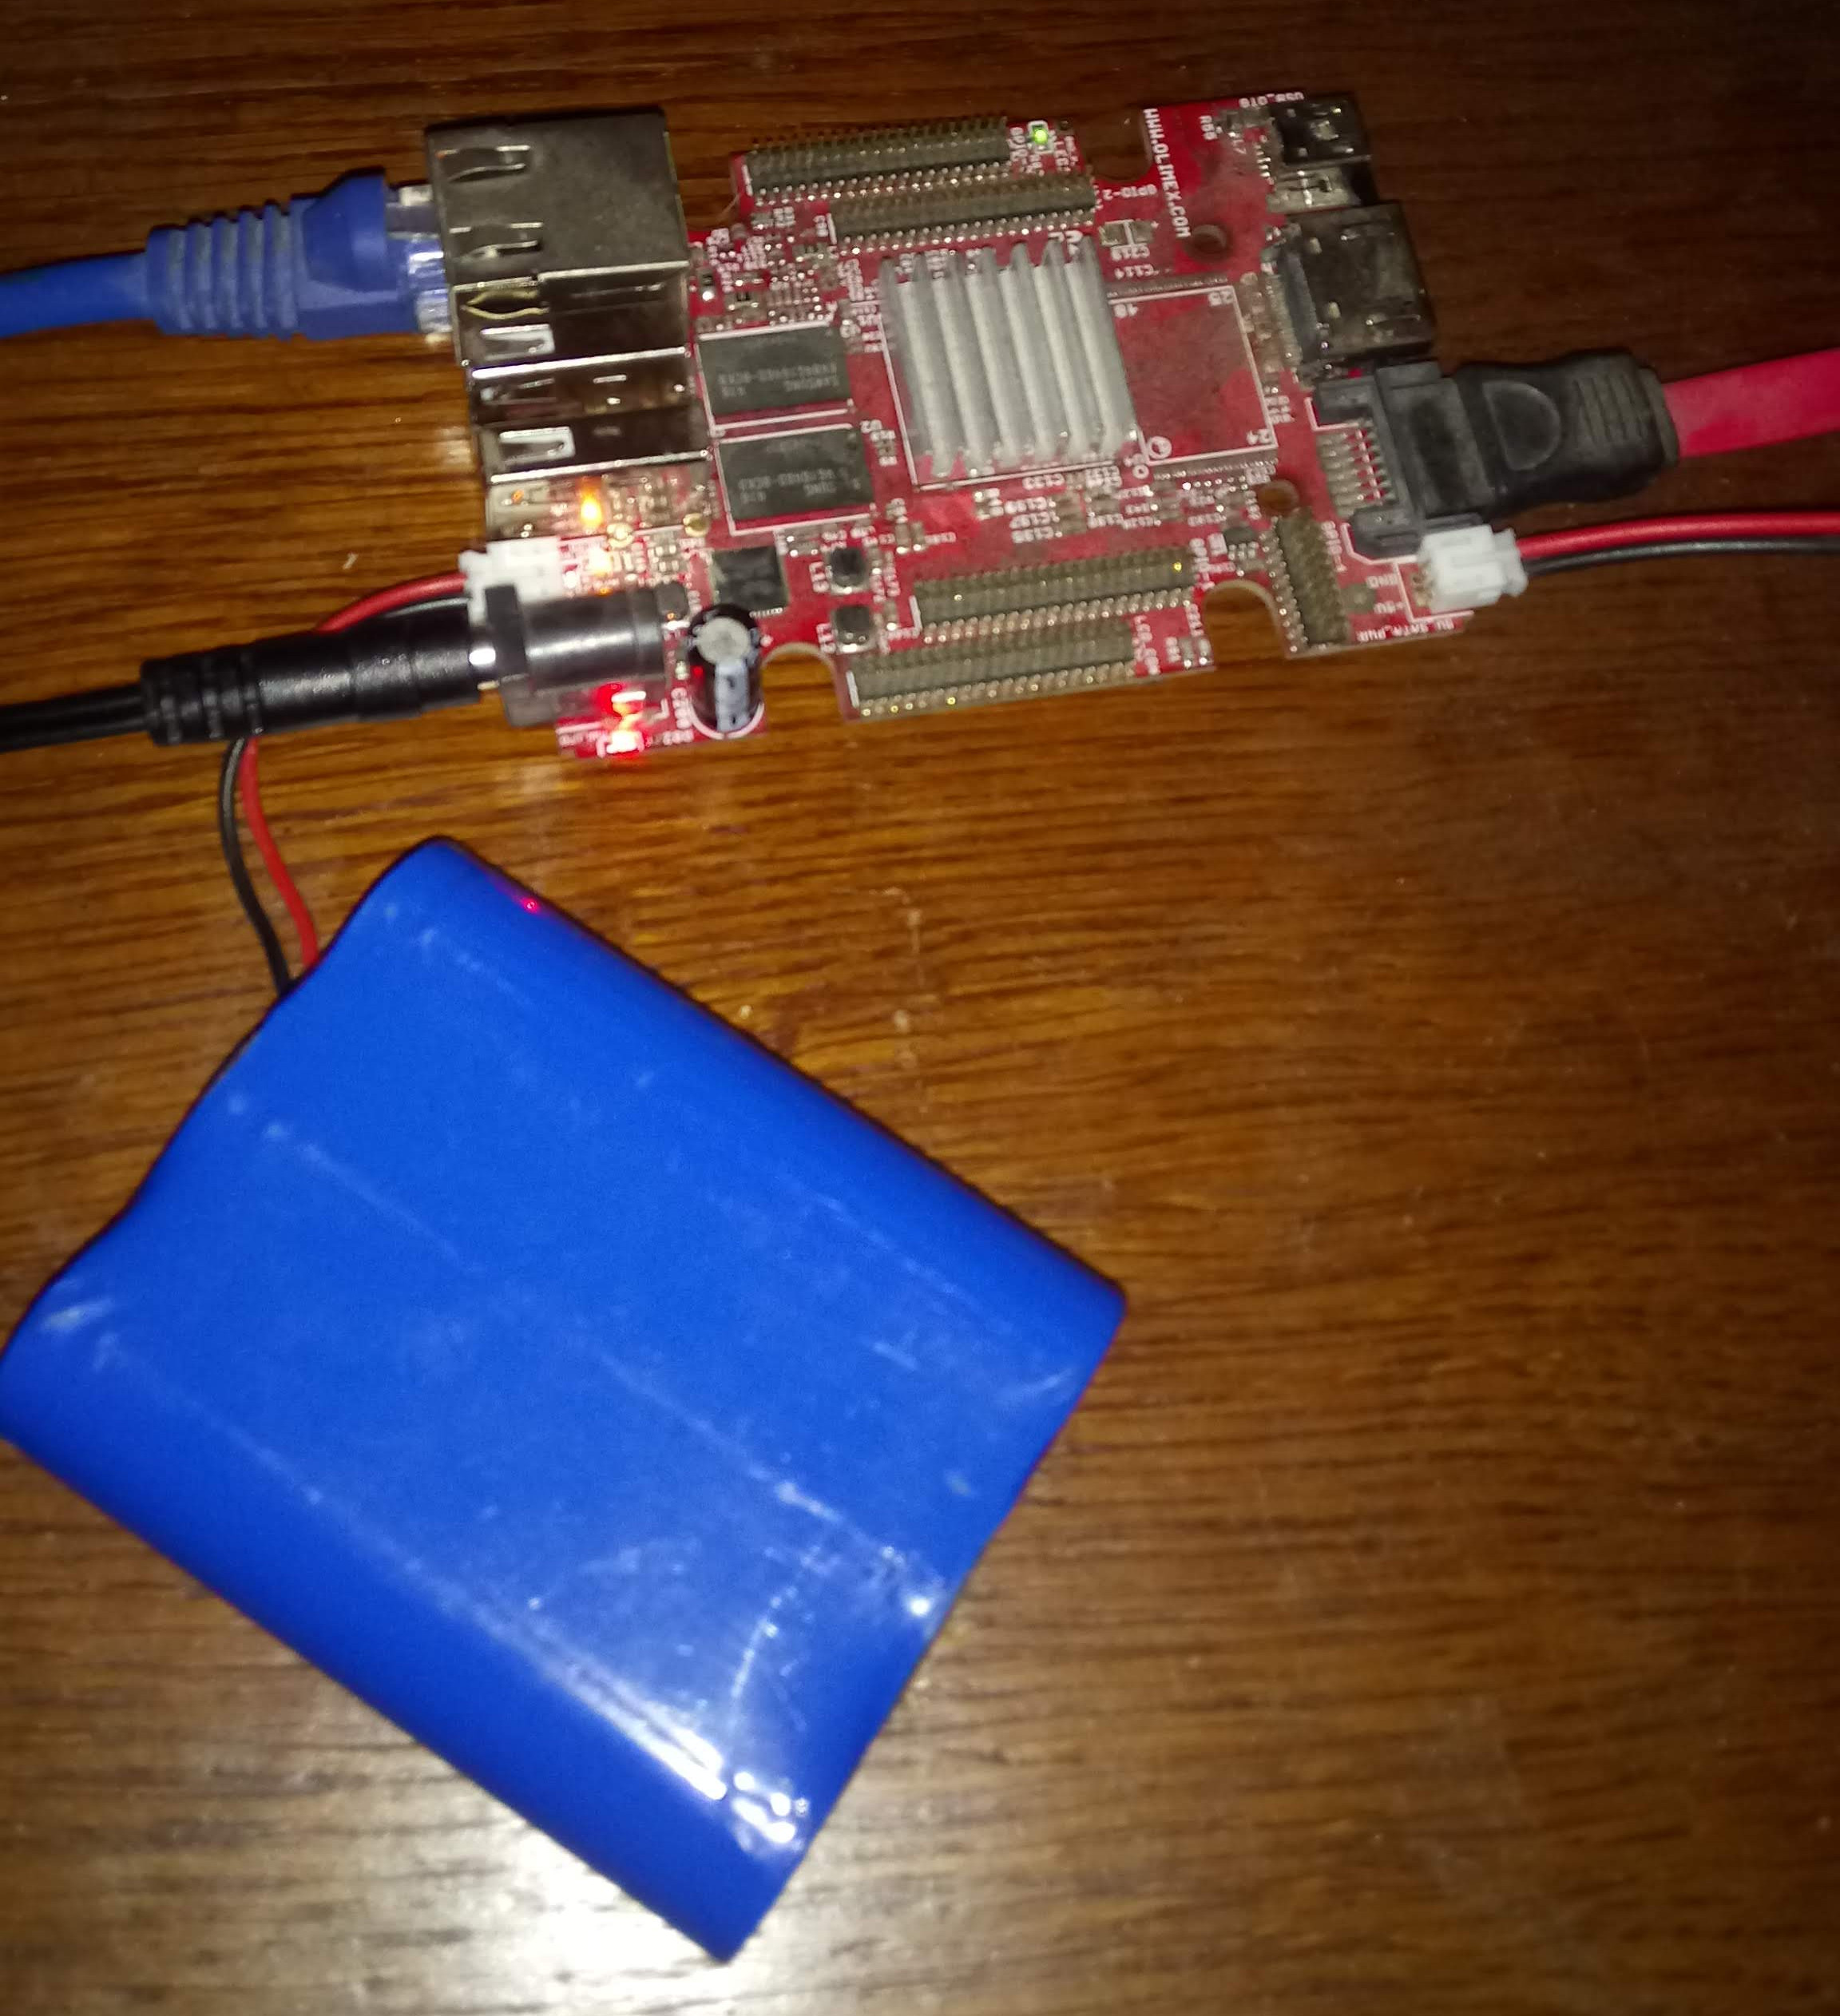
Olimex A20-OLinuXino-LIME2 – 8 years in service, 2 PSUs and 1 SD-card down
4 years ago I posted a 4 year review of the Olimex LIME2. It seems that the lifetime of power supplies is approximately 4 years as now another power supply died, and this time also the SD-card was expiring. The LIME2 lives on however!
It was a bit hard to notice, because the battery pack of the LIME2 kept it running pretty well even with the poor power supply. So, better monitoring of the battery pack is also on the todo list.
Recovering the bad SD-card
Recovering the SD-card was relatively easy with minimal dataloss, when out of the LIME2:
$ sudo ddrescue /dev/mmcblk0 backup.img
# Put in a new SD-card
$ sudo dd if=backup.img of=/dev/mmcblk0 bs=16M
I have done this a couple of times with other SD-cards from Raspberry PIs, and though there is the potential for dataloss it is usually minimal. This time a few blocks were lost.
Upgrading Debian from Stretch to Bullseye
I took the opportunity to upgrade the Debian install while the system was offline anyway. Upgrading was generally painless, following the usual Debian method. I went through the Buster release just to be sure:
$ vim /etc/apt/sources.list
# replace all "stretch" with "buster" :%s/stretch/buster
$ apt update && apt upgrade && apt full-upgrade
$ reboot
$ vim /etc/apt/sources.list
# replace all "buster" with "bullseye" :%s/buster/bullseye
$ apt update && apt upgrade && apt full-upgrade
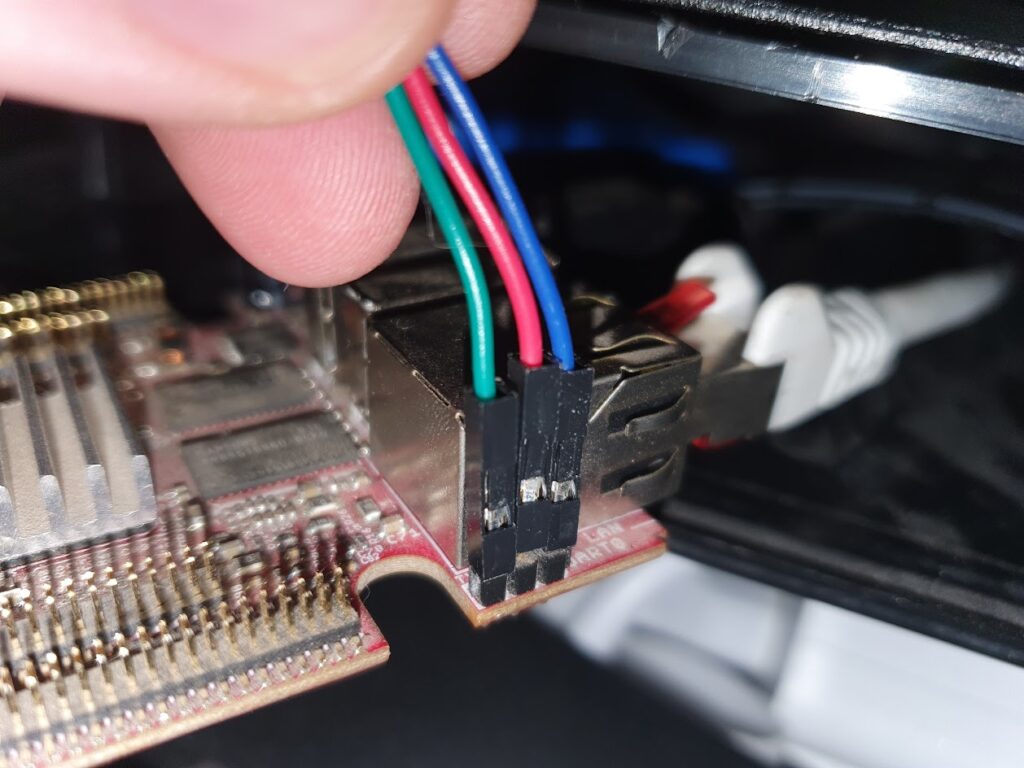
$ rebootThe only tricky part is booting the new kernel. Since that always fails for me on the first try, I always hookup the serial console. For future reference, this is how to hookup the serial console (which is TTL 3.3V):
Now, of course the boot failed. I tried getting the flash-kernel package to work for my setup, but for historical reasons I have a separate boot partition. In the end I derived a simple bootscript from that package, that boots from p1 but loads the kernel, fdt and initrd from p2:
setenv bootargs  ${bootargs} console=ttyS0,115200 root=/dev/mmcblk0p2 rootwait panic=10

#setenv fk_kvers '4.19.0-21-armmp-lpae'
setenv fk_kvers '5.10.0-18-armmp-lpae'
setenv fdtpath dtb-${fk_kvers}

load mmc 0:2 ${kernel_addr_r} /boot/vmlinuz-${fk_kvers}
load mmc 0:2 ${fdt_addr_r} /boot/${fdtpath}
load mmc 0:2 ${ramdisk_addr_r} /boot/initrd.img-${fk_kvers}
bootz ${kernel_addr_r} ${ramdisk_addr_r}:${filesize} ${fdt_addr_r}
The script can be manually input over the serial terminal, and thereby tested out.
The only downside is it needs to be manually updated after each kernel upgrade. To activate the uboot bootscript:
$ mount /dev/mmcblk0p1 /mnt/
$ cd /mnt
# ensure boot.cmd is as above
$ mkimage -C none -A arm -T script -d boot.cmd boot.scr
Monitoring the LIME2 battery pack
After upgrading to a recent 5.X mainline Linux kernel the battery pack is exposed in the sysfs filesystem:
$ cat /sys/class/power_supply/axp20x-battery/voltage_now
4070000 # 4.07 V
$ cat /sys/class/power_supply/axp20x-ac/voltage_now
4933000 # 4.93 V
I setup a couple of alerting rules for these in my home monitoring setup, so hopefully the next time the LIME2 defeats a power supply I’ll get notified.
Conclusion
I can still warmly recommend the LIME2. It is still available, and even a bit cheaper nowadays at 40 EUR + VAT, and still a little workhorse that just keeps on going.
Grundfos Alpha 2 pumpe går i stykker og flimrer: reparer den med en kondensator til nogle få kr
Som med så mange andre huse fulgte der en Grundfos Alpha 2 cirkulationspumpe med da vi købte et hus. Den pumpede og pumpede, indtil den var blevet 13 år gammel: så begyndte den at flimre når den skulle starte op. Det er jo som sådan en rimelig hæderlig levetid, men også lidt mistænkeligt at det ikke virkede til at være et mekanisk problem.
Symptomerne er:
- Pumpen kan køre fint i længere tid
- Ved længere tids stop kan den ikke starte; nogen gange starter den efter noget tid
- Ved opvarmning starter pumpen, f.x. med en varmepistol
Det sidste punkt har gjort at der flere steder bliver spekuleret i at der er “kondens” i pumpen.
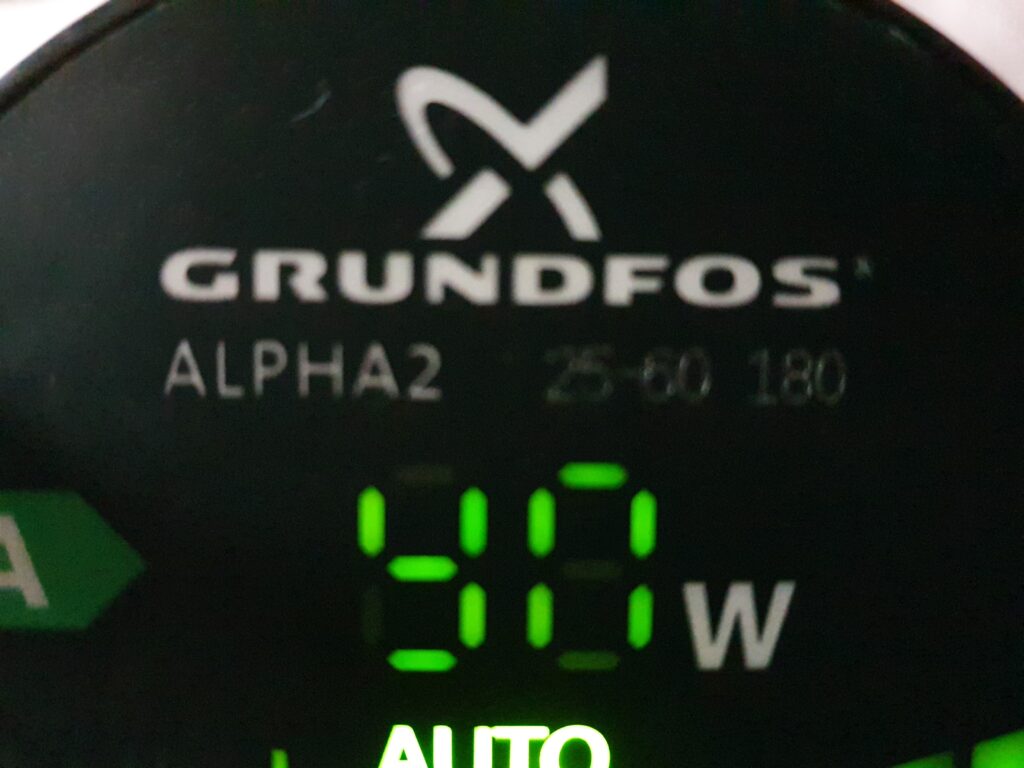
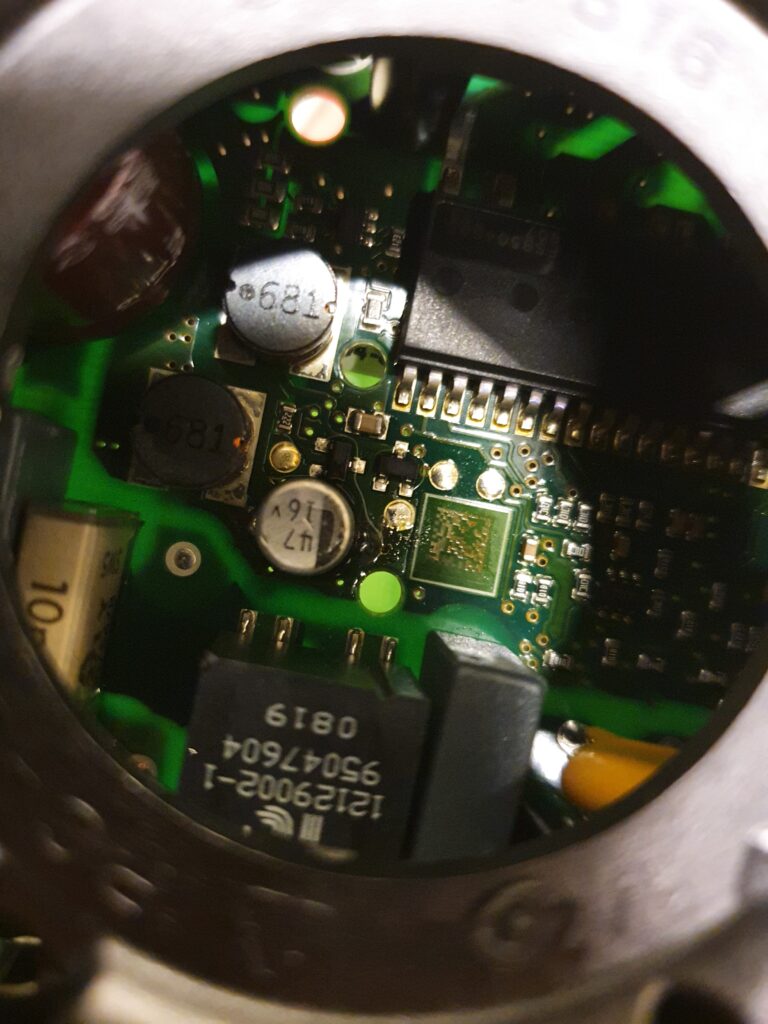
Det er dog ikke problemet. Problemet er en lille kondensator der holder strøm til lavspændingselektronikken:
I Hal9k eksperimenterede vi en smule for at verificere: hvis man køler den ned med f.x. sprit opstår problemet med det samme. Hvis man varmer den op starter pumpen med det samme.
For en udførlig vejledning i hvordan pumpen skilles ad og kondensatoren skiftes har Simon lavet en video:
Men hvad er kilden til problemet så? Kondensatoren får over tid en alt for stor indre modstand, og spændingstabet bliver for stort. Her et par målinger uden og med lidt sprit til ekstra afkøling:
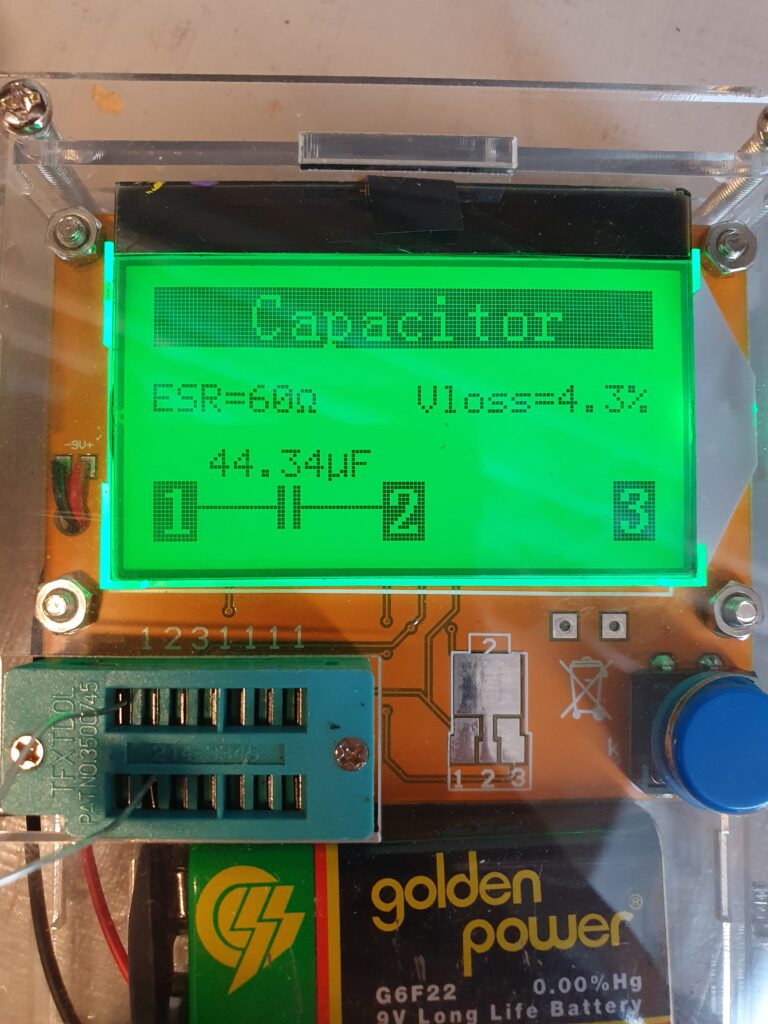
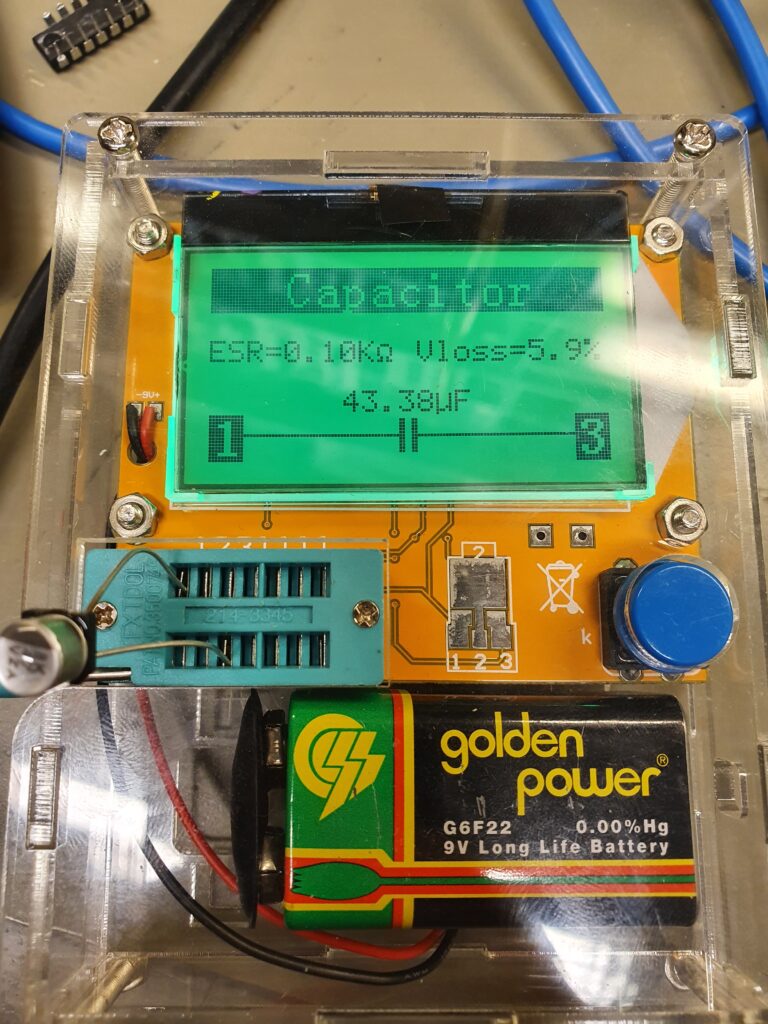
En helt ny kondensator måler under 1 ohms modstand, altså 100 gange så lille indre modstand:
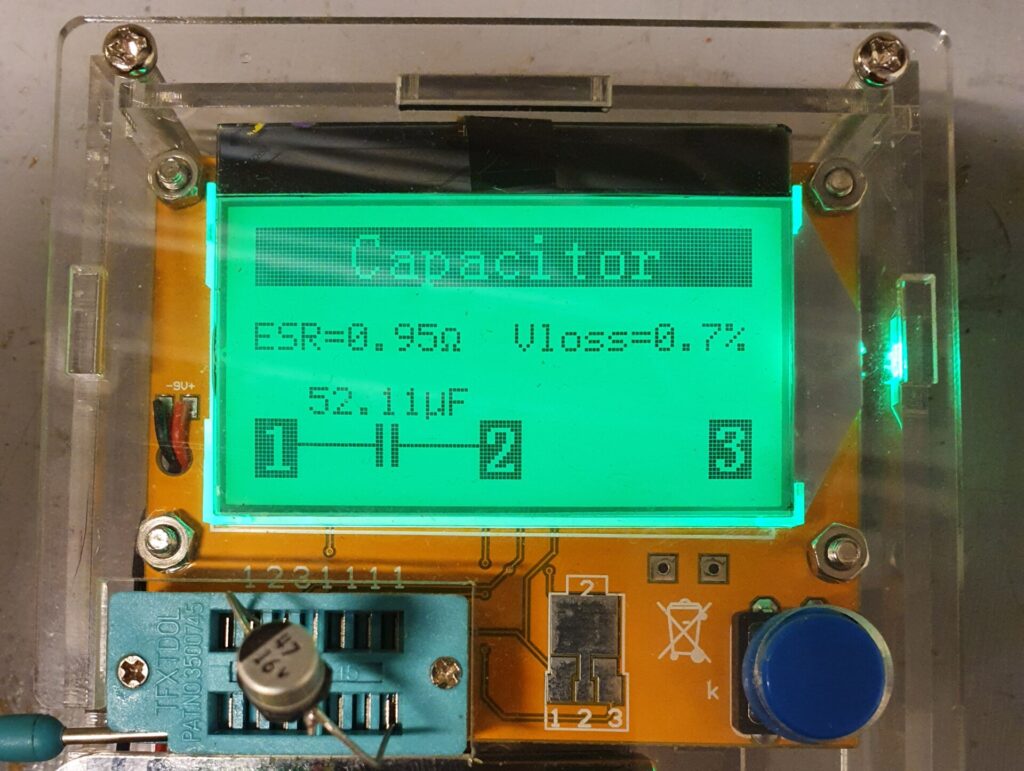
En ny kondensator kan findes ved at søge på “47 uf 16 v smd electrolytic capacitor”, f.x. TME.eu, eller endnu mere lokalt fra el-supply.dk.
Så hvad kan man lære af hele denne historie?
Grundfos laver mekanisk gode pumper, men sparer på deres elektronik. Det er trist at tænke på hvor mange pumper der mon er smidt ud lang tid før tid. Man kan nok ikke beskylde Grundfos for “planned obsolence” efter 13 år, men man kunne dog ønske at produktet fejlede i en mere brugbar konfiguration: f.x. at pumpen kører ved et minimum hvis elektronikken fejler.
Reparation af Aduro-tronic II
Vi har en Aduro 1-2 brændeovn med Aduro-tronic, som vi generelt er rigtig glade for. Den har nu været i drift i 5 år, og har haft omkring 4500 optændinger. Generelt er designet rigtig fornuftigt, og med Aduro-tronic og Smart Response er det rigtig nemt at fyre korrekt.
Den eneste anke må være at vi nu 2 gange har oplevet at Aduro-tronic stemplet har givet op:
Første gang købte jeg et nyt, men det viste sig at være ret nemt at reparere. Så da problemet opstod igen reparerede jeg bare det gamle stempel.
Aduro-tronic er basalt set en utæt luftcylinder med en fjeder. Stemplet trykkes ind, fjederen bliver spændt og som lufter langsomt trækker ud af cylinderen kører stemplet op igen. Hvor utæt cylinderen er justeres med den lille skrue, og dette sætter således tiden spjældet holdes åbent.
Problemet opstår når aske, støv og lignende sætter sig inde i cylinderen, og over tid får foringen til at blive utæt. Derved er stemplet for utæt.
Løsningen er simpel:
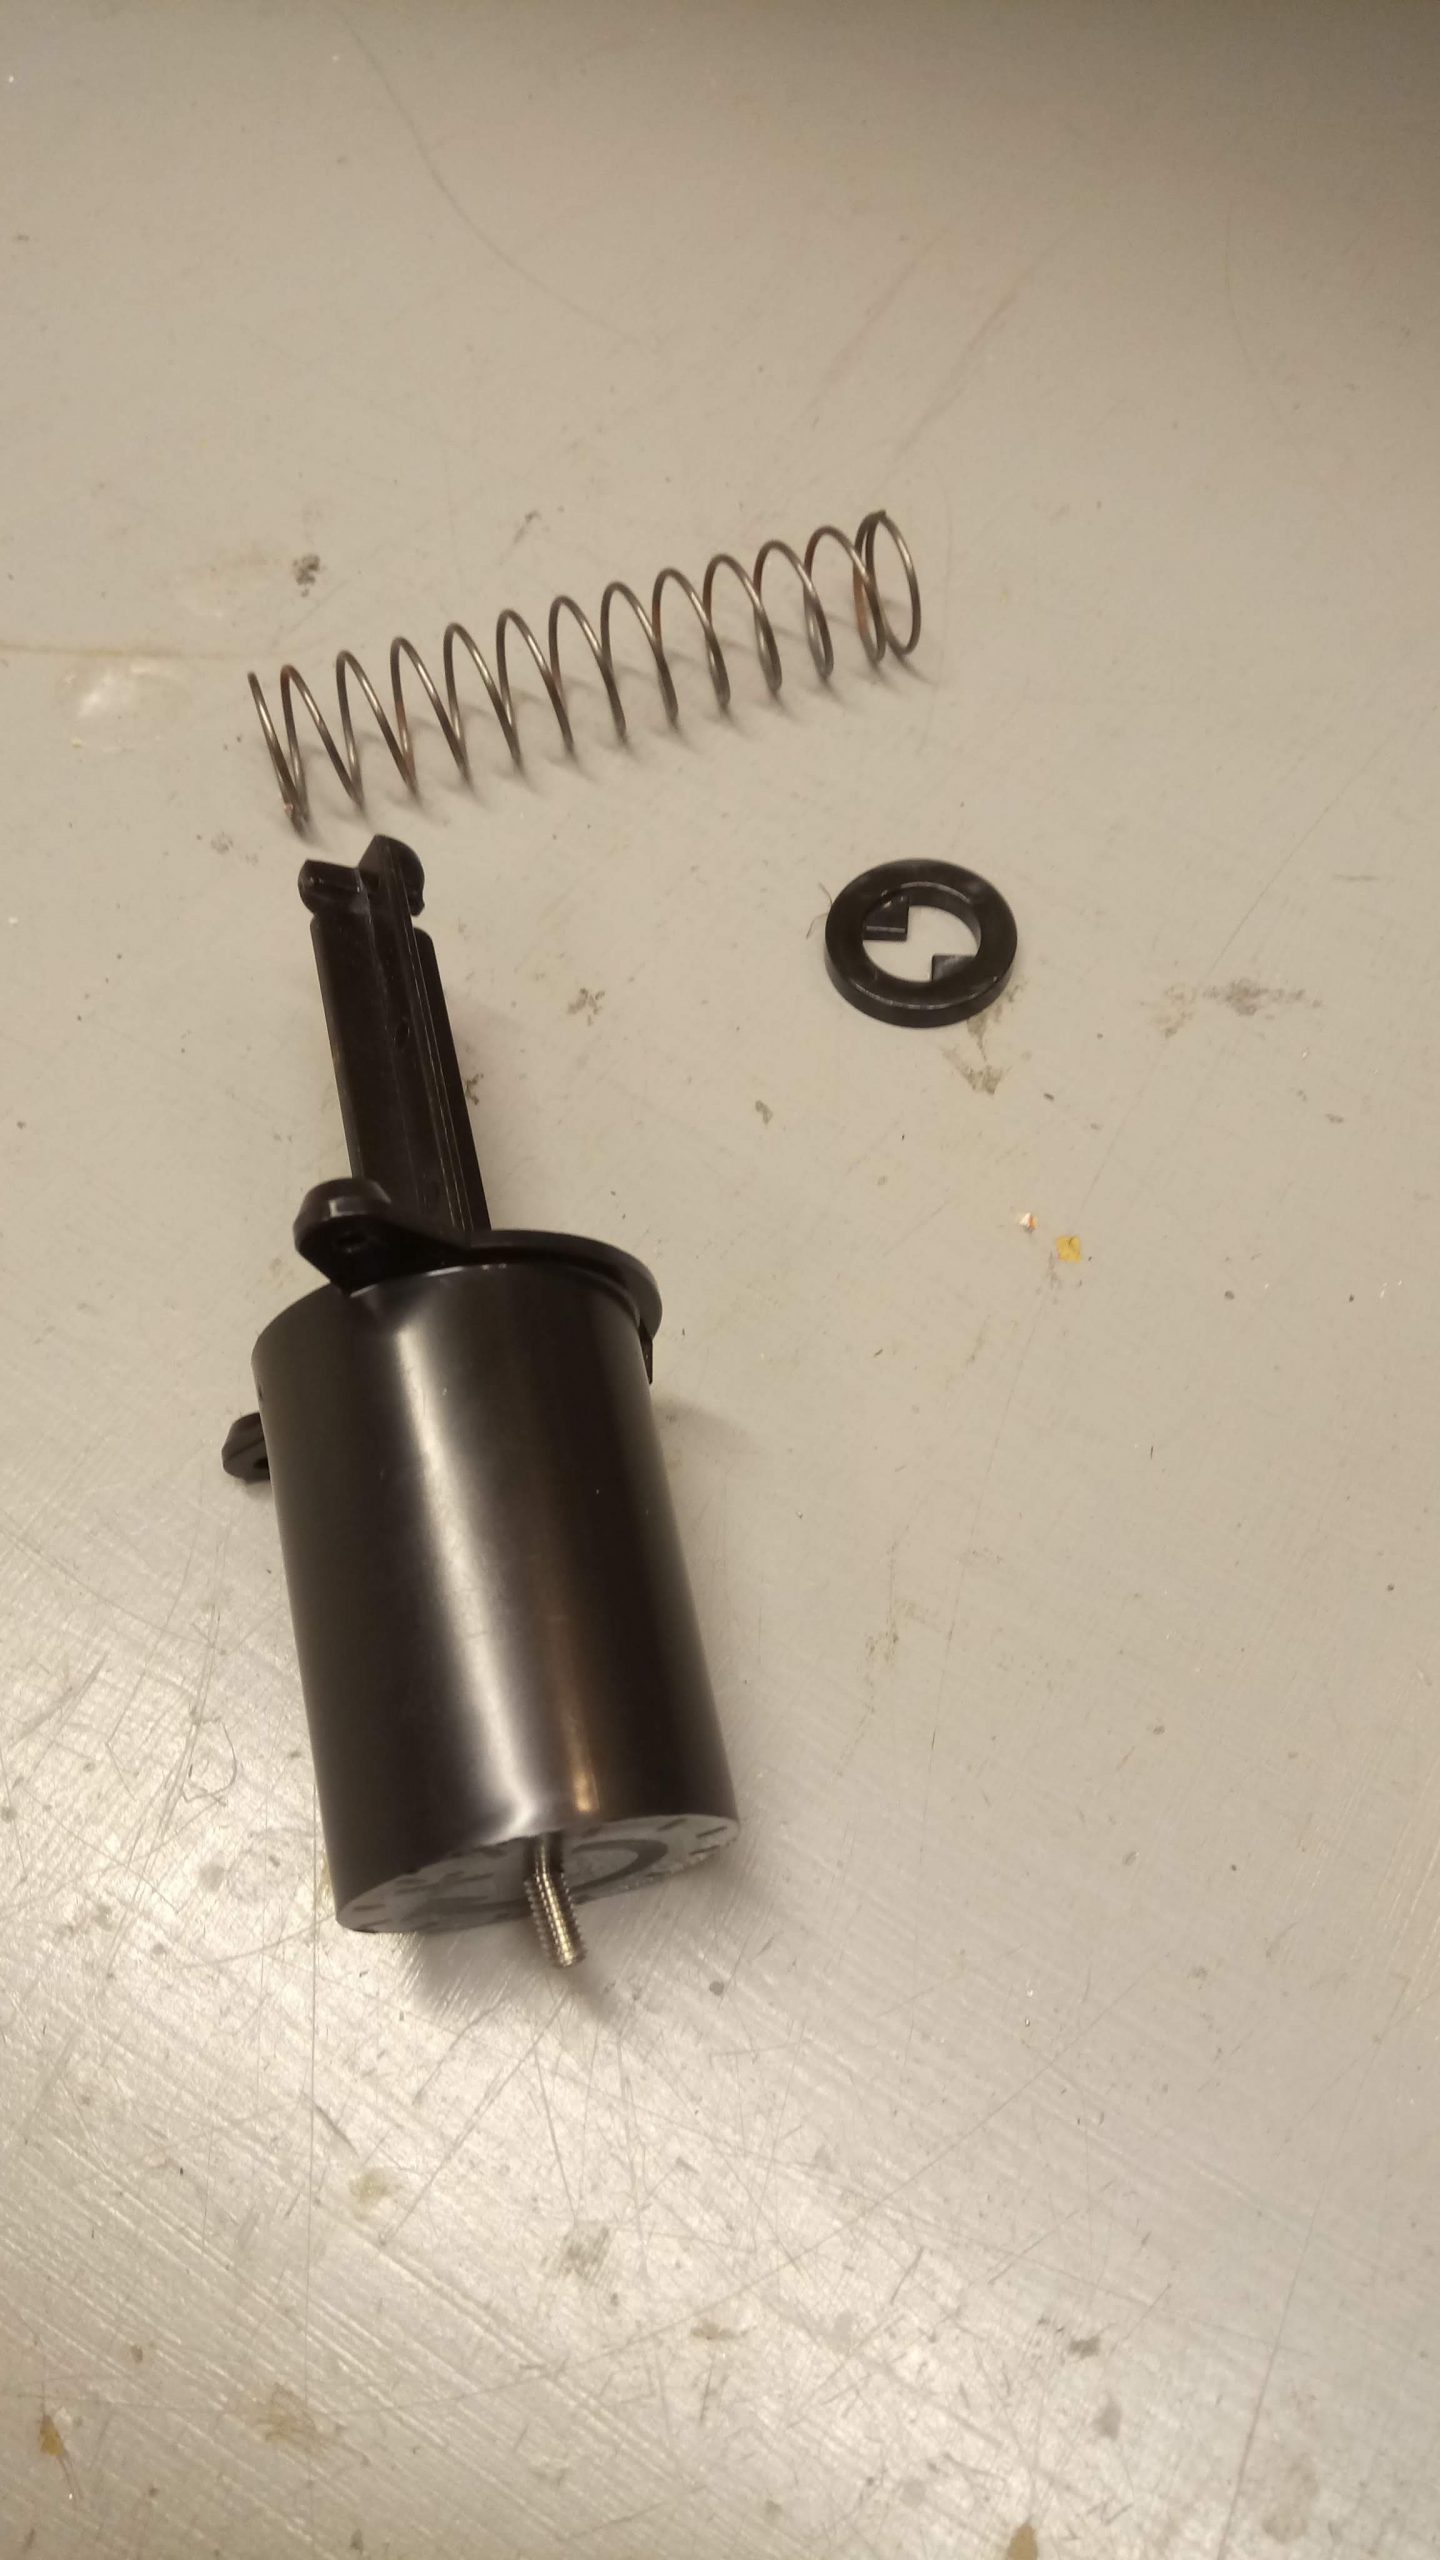

Rengør nu cylinderen, og smør stempel og cylinder med en lille smule silikone-spray der hjælper med at forsegle.
Saml hele mekanikken igen, tryk stemplet ned og check at det nu bliver nede af sig selv. Når mekanikken igen er monteret på brændeovnen skal tiden nok indstilles forfra.
Sniffing Philips Hue Zigbee traffic with Wireshark
I have a Philips Hue gateway at home that is connected to a number of Philips Hue lights, as well as some IKEA trådfri light bulbs, and a couple of OSRAM Lightify light strips. Most of the time the network works quite well, but some of the time a few of the lights become unreachable. I read a rumor online that the Hue lights and the other lights are actually on two different Zigbee networks. Of course, if only I had a way of sniffing the Zigbee traffic I could diagnose these problems. And thus began this quest.
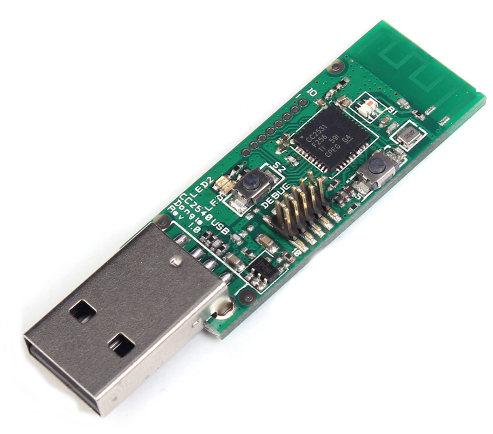
I started by buying a Zigbee sniffer, I found that the Texas Instruments CC2531 chip is widely used, and available in a cheap USB package. I purchased this USB CC2531 Zigbee sniffer, but others are probably equally good. After the dongle arrived I spent quite a while thinking that I need to replace the stock firmware, because of various old projects on GitHub (Sensniff, ccsniffpiper, etc.). Fortunately, you do not need to change the stock firmware. The best software package seems to be KillerBee which supports both sniffing and injection; however only sniffing with the CC2531. Installing KillerBee on Ubuntu is quite easy. You need to install scapy, and a few dependencies. The installation instructions are probably more up to date than this blog post.
Starting the sniffing is really easy, if you know the channel the Philips Hue is operating at. I think channel 11 is the default, but it is displayed in the Hue app, under info for the bridge:
sudo zbwireshark -c 11
This will launch a background process, and an instance of Wireshark that is monitoring the channel. At this point you can see the traffic; but everything is encrypted…
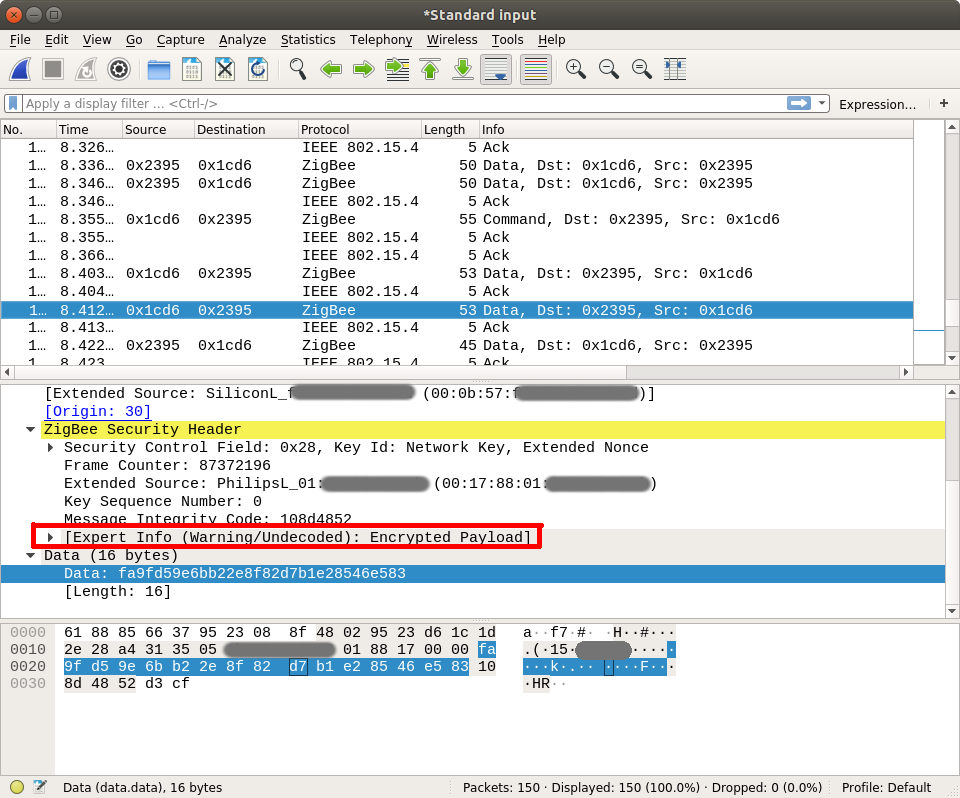
A very incomplete intro to Zigbee encryption
Zigbee traffic can be encrypted with AES-128, which is a symmetric encryption scheme. This means the key to encrypt and decrypt is the same. There is a number of keys that can be used to encrypt a single packet payload:
- The Network Key, which is unique to this Zigbee network. This is what we will ultimately need to find. It is generated by the gateway, and shared by all the devices on the network. How does a new device join the network then? It uses the…
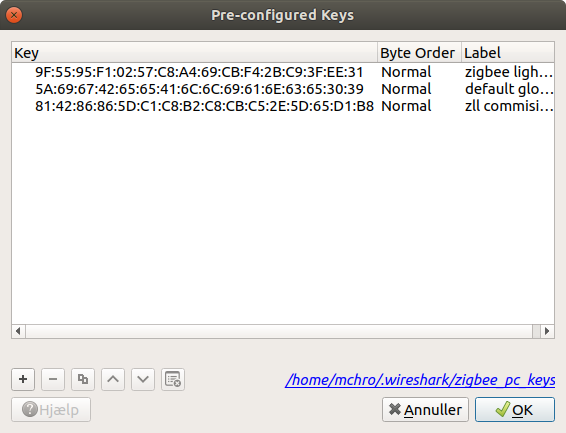
- The Key-Transport Key which is a pre-shared secret. Apparently there is a number of these, depending on the class of devices and type of network. These are apparently a well-kept secret or something, although widely available on the internet:
- “default global trust center link key” which is 5A:69:67:42:65:65:41:6C:6C:69:61:6E:63:65:30:39
- “light link master key” which is 9F:55:95:F1:02:57:C8:A4:69:CB:F4:2B:C9:3F:EE:31
- “light link commissioning key” which is 81:42:86:86:5D:C1:C8:B2:C8:CB:C5:2E:5D:65:D1:B8
You can add these keys to Wireshark, and the Zigbee dissector will then try to decrypt traffic using them. Go to Edit -> Preferences -> Protocols -> ZigBee and edit the pre-configured keys:
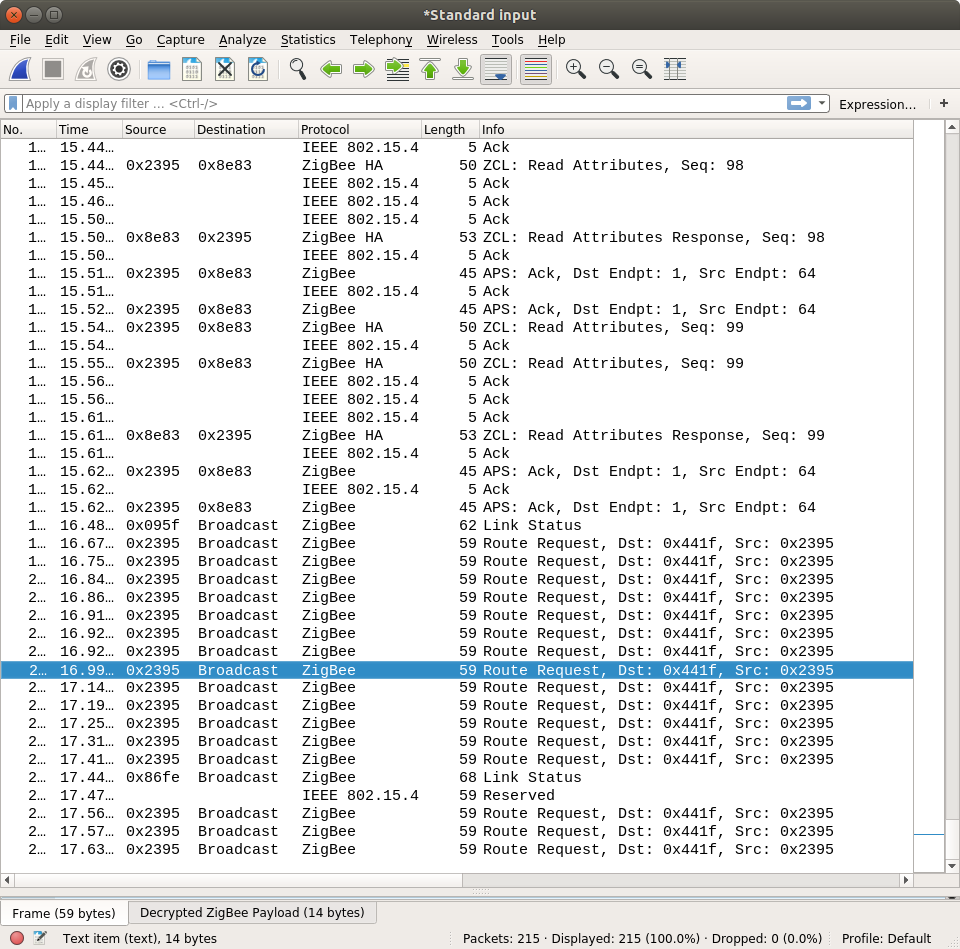
The Key-Transport Key is used whenever a new device joins the network with the sole purpose of encrypting the network key. So, to find the network key we need to know the Key-Transport Key, and observe the traffic when a device joins. So this is what I did: I found an IKEA Trådfri lightbulb and spent the frustrating time needed to get it to join the Philips Hue gateway (resetting the bulb, searching for new lights). Finally, it suceeded!
Now, by adding the transport key to the list of keys in Wireshark all the traffic on the network was able to be decrypted!
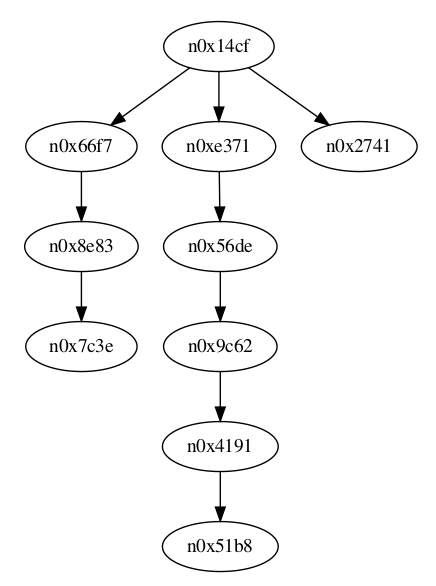
The next step will be to analyze the traffic, and understand the routing. Very initial probes using zigbee-viewer indicates that there is indeed three distinct routings:
Dør jeg af partikelforurening fra min moderne brændeovn?
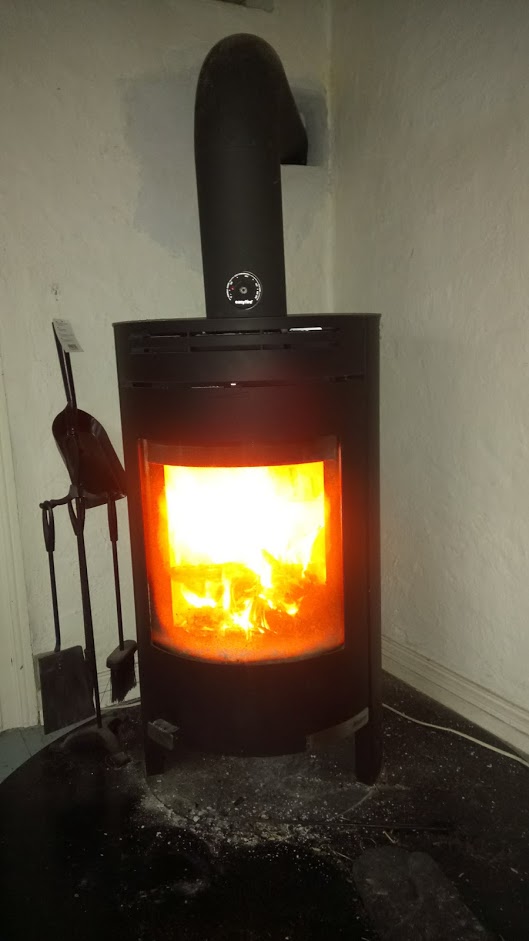
Vi har en fin moderne brændeovn derhjemme (en Aduro 1-2), som vi bruger ret intensivt til opvarmning af vores gamle stuehus. Et meget relevant spørgsmål er derfor: hvor meget bidrager sådan en moderne brændeovn til partikelforureningen i vores stue?
Partikelforurening er små partikler af støv og sod, der bl.a. fremkommer ved afbrænding af fossile brændsler, som olie og træ. De kan forårsage forskellige slags sundhedsproblemer, bl.a. kræft. På et interaktivt partikelkort kan man se hvilke niveauer der (beregnet) var i Danmark i 2012, og f.x. forskellen mellem land og by; årsgennemsnittet for PM2.5 lå på 5.3 – 11.9 μg/m3.
Det er et ganske egoistisk projekt jeg har gang i: jeg har ingen data for hvor stor partikelforureningen er udenfor huset, men kun inde i selve stuen. Der er en del kilder til partikelforurening som jeg kender til, eller har observeret:
- Vi har et pillefyr, der står i nærheden, der også kører i den kolde tid
- Vi bor i kort afstand fra en lettere befærdet vej
- Madlavning, specielt med en gammel emhætte, kan bidrage betydeligt
- Den generelle baggrundsvariation kan være betydelig
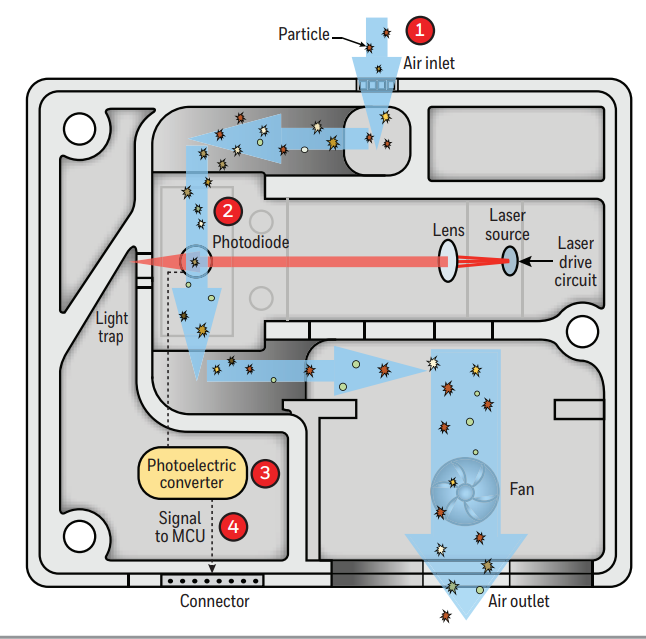
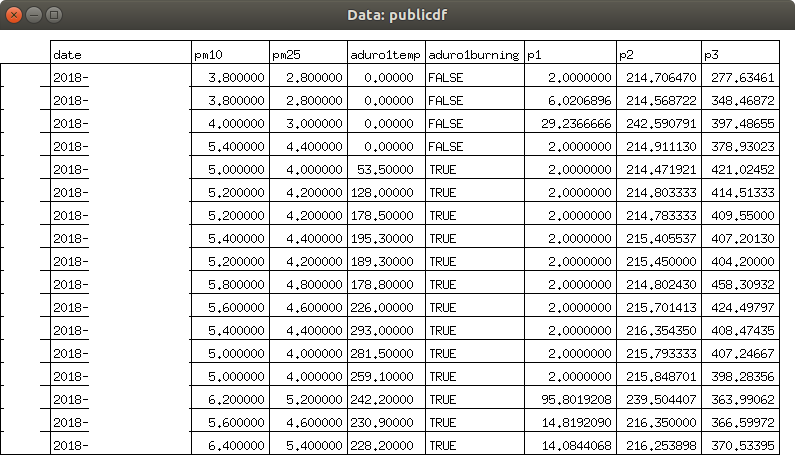
For at undersøge det har jeg opsat en partikel sensor (en Honeywell HPMA-1150S0) i stuen, ca. 3 m fra brændeovnen. Samtidig registrerer jeg brændeovnens temperatur, via en Aduro Smart Response sensor. Dette har jeg nu gjort i lidt over et år, og kan dermed lave en data analyse på et års data.
Til brug for analysen er der registreret PM10 og PM2.5 værdier, ifølge databladet i μg/m3. Sensoren skulle desuden være “fully calibrated”, og kunne køre i mindst 20.000 timer, så et års data burde man kunne stole på. Usikkerheden er dog angivet til +/- 15 μg/m3, eller +/-15% alt efter målingen; i praksis virker den dog til at være ret stabil i værdierne. Sensoren beregner PM10 værdier ud fra PM2.5 værdier, så jeg vil primært fokusere på analyse af PM2.5 værdierne. Data er optaget med et interval på 5 minutter, men med sensor læsninger ca. hvert 6 sekund der så er aggregeret ved gennemsnit (Der er brugt HPMA-1150S0 sensorens “auto-send”).
Brændeovnens temperatur er målt som foreskrevet af Aduro Smart Response, dvs. i den øvre del af brændkammeret på vej mod røgrøret. Aduro sensoren sender data i ca. 4 timer. Jeg har defineret at brændeovnen er i brug, hvis temperaturen er registreret, dvs. afkøling også er talt med.
Vi bruger vores brændeovn en hel del i de kolde måneder. Faktisk helt op til halvdelen af tiden:
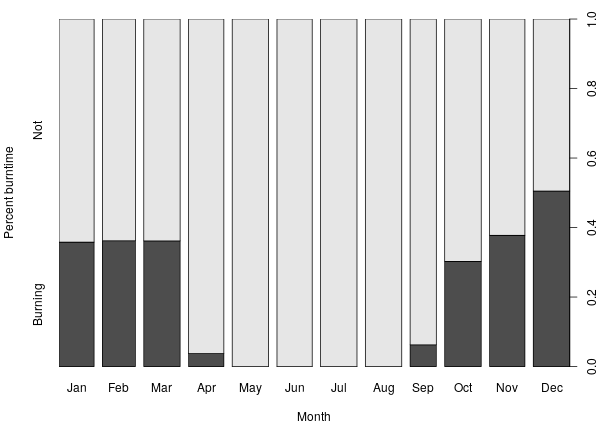
Det passer meget godt med at vi bruger brændeovnen næsten alt tid vi er hjemme, i de kolde måneder.
Vi tænder op efter forskrifterne og bedste evne; genindfyring sker typisk ved 175C eller 150C ved at lægge 2-3 stykker brænde ind, og åbne spjældet (der så ved Adurotronic lukker over ca. 6 minutter). Der er naturligvis stor variation i præcis hvornår der lige bliver genindfyret. Og en sjælden gang imellem glipper optændingen, og giver røg i stuen. Men generelt opleves fyringen som ganske uproblematisk.
Gennem året har jeg lavet lidt observationer, og min subjektive vurdering for partikelforureningen er ca.:
- Der er normalt meget lille partikelforurening, 2-3 μg/m3
- Ved god optænding stiger forureningen med 1-2 μg/m3
- I nogle perioder er baggrundsforureningen højere, lige under 20 μg/m3
- Ved uheldig opførsel stiger partikelforureningen drastisk – helt op til 900 μg/m3; det kan f.x. være ved dårlig optænding, eller ved madlavning.

Uheldig optænding. 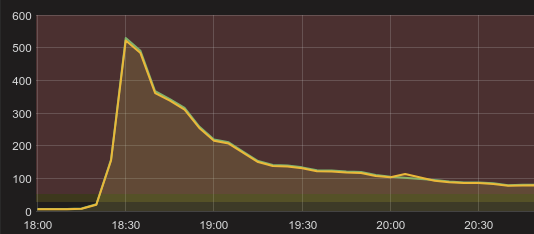
Uheldig baconstegning.
Målinger
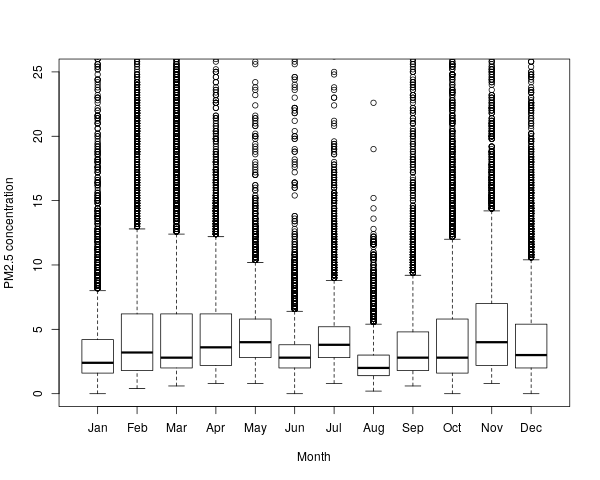
Som det kan ses er der en del variation imellem månederne. Der er også en hel del outliers, der trækker gennemsnittet op, mens medianen for alle måneder ligger under 5 μg/m3.
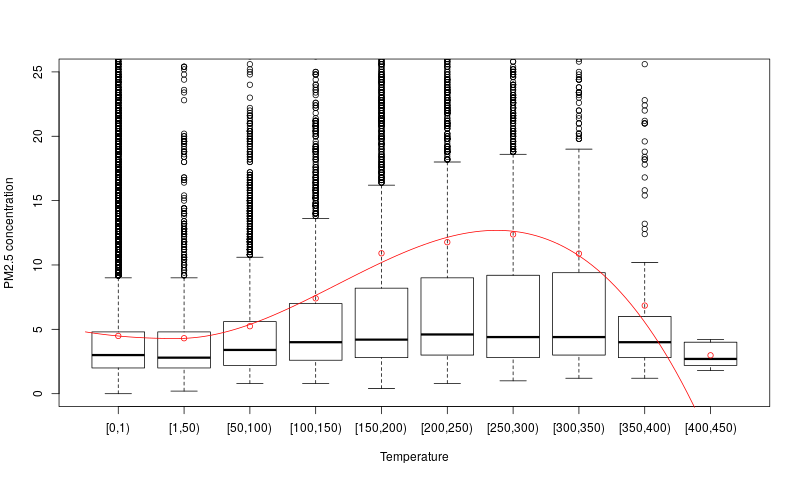
Mere interessant er det om partikelforureningen påvirkes af brændeovnens temperatur, og dermed dens brug. Det ser det bestemt ud til! Selvom median værdierne ikke stiger meget stiger specielt 3. kvartil. Gennemsnitsværdierne stiger også, helt op til 12.37 μg/m3 for intervallet [250, 300). En tolkning af dette kunne være at der normalt (median) ikke er ret meget mere partikelforurening, men det sker hyppigere at der er store koncentrationer til stede.
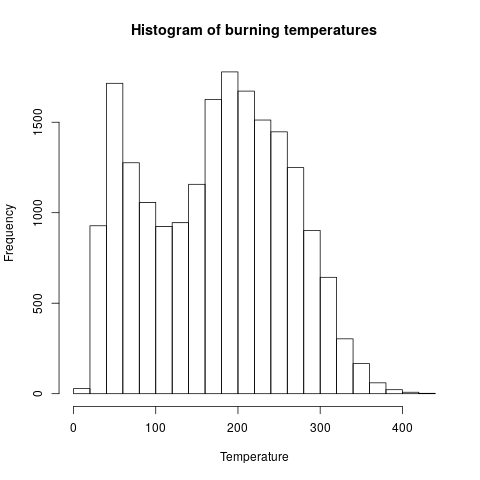
Det bør noteres at der ikke er særlig mange målinger over 350C, som det kan ses af histogrammet for hvilke brændeovnstemperaturer der er registreret:
Fejlkilder
Der er et par fejlkilder i målingerne:
- Der mangler en uges data i september, hvor en strømforsyning stod af mens vi var på ferie.
- Partikelsensoren giver nogle meget højere målinger i et enkelt punkt, engang imellem. Checksummen fra sensoren ser ud til at passe, så hvad præcist problemet er ved jeg ikke. Jeg har først filtreret åbenlyst forkerte målinger (<0 eller >1000) fra i databehandlingen, men pga. gennemsnittet over de 5 min kan nogle åbenlyst forkerte målinger stadig være talt med.
- Brændeovnssensor har nok manglet batteri en dag eller to, det kan jeg ikke helt huske.
Analyse
| PM2.5 | |
| Årligt gennemsnit | 5.44 μg/m3 |
| – Årligt gennemsnit, brændeovn i brug | 9.28 μg/m3 |
| – Årligt gennemsnit, brændeovn ikke i brug | 4.49 μg/m3 |
Alle værdier er under EU’s grænseværdi, på 25 μg/m3 PM2.5. Hvis vi antager at målingerne mens brændeovnen ikke er i brug er repræsentative for hele året, så har brændeovnen bidraget med 0.95 μg/m3 PM2.5 til års gennemsnittet.
Hvor farligt er det så?
Et studie fra 2013 af sammenhængen mellem partikelforurening og lungekræft fandt (eftersigende, jeg har ikke adgang til artiklen men kun til resuméet på Videnskab.dk) at selv små stigninger i partikelforurening giver øget risiko for lungekræft.
For småkornet luftforurening [PM2.5] stiger risikoen for lungekræft med 18 procent per fem ekstra mikrogram svævestøv, men det resultat var ikke statistisk signifikant. Det var alle resultaterne for risikostigning under det tilladte niveau heller ikke.
Videnskab.dk: Små mængder forurening øger faren for kræft
Hvis vi antager at det resultat holder, og at virkningen er lineær, vil den øgede forurening på 0.95 μg/m3 PM2.5 øge risikoen for lungekræft med 3.42%.
Enkeltstående tilfælde
Et andet problem kunne være hvis enkeltstående tilfælde af høj luftforurening var specielt sundhedsskadeligt, som indikeret af at EU for PM10 også har en daglig grænseværdi (50 μg/m3), og et antal tilladte overskridelser per år (35). Der er 0 dage hvor den daglige PM10 grænseværdi har været overskredet. Jeg har alligevel analyseret de 35 dage med det højeste gennemsnit, og forsøgt at klassificere de årsager (primær og sekundære) til de høje værdier. Det har jeg gjort ved at kigge på brændeovnstemperaturen, strømforbruget, tidspunket på dagen, osv. Disse tal må derfor siges at være min subjektive vurdering.
| Primær årsag | Sekundær årsag | |
| Madlavning | 19 | 3 |
| Baggrund | 11 | 1 |
| Brændeovn | 3 | 15 |
| Ukendt | 2 | 0 |
De primære årsager til høje målinger ser ud til at være madlaving og baggrund, mens brændeovnen bidrager til halvdelen af de høje dagsgennemsnit.
Konklusion
Vores moderne brændeovn bidrager med 0.95 μg/m3 PM2.5 til års gennemsnittet, og øger dermed vores risiko for lungekræft med 3.42%. Hvis vi f.x. flyttede til en større by som København ville vi opleve en væsentlig højere forøgelse til måske 10 μg/m3, ifølge modelberegningen, hvilket ville øge risikoen for lungekræft med 16%.
Hvis man ser på PM2.5 koncentrationer ifht. brændeovnens temperatur, ser det ud til at brændeovnen for det meste (målt på medianen) ikke udleder ret mange partikler, men bidrager til at høje forureningskoncentrationer optræder oftere (som set på de øgede gennemsnitsværdier, og forøgede 3. kvartil).
Brændeovnen bidrager til 18 af de 35 højeste dagsmålinger, mens de primære årsager til høje dagsmålinger er madlavning og baggrundsforurening.
18650 Lithium-ion battery packs – 1S80P
This is the considerations I did when building 1S80P 18650 battery packs, for a DIY powerwall.
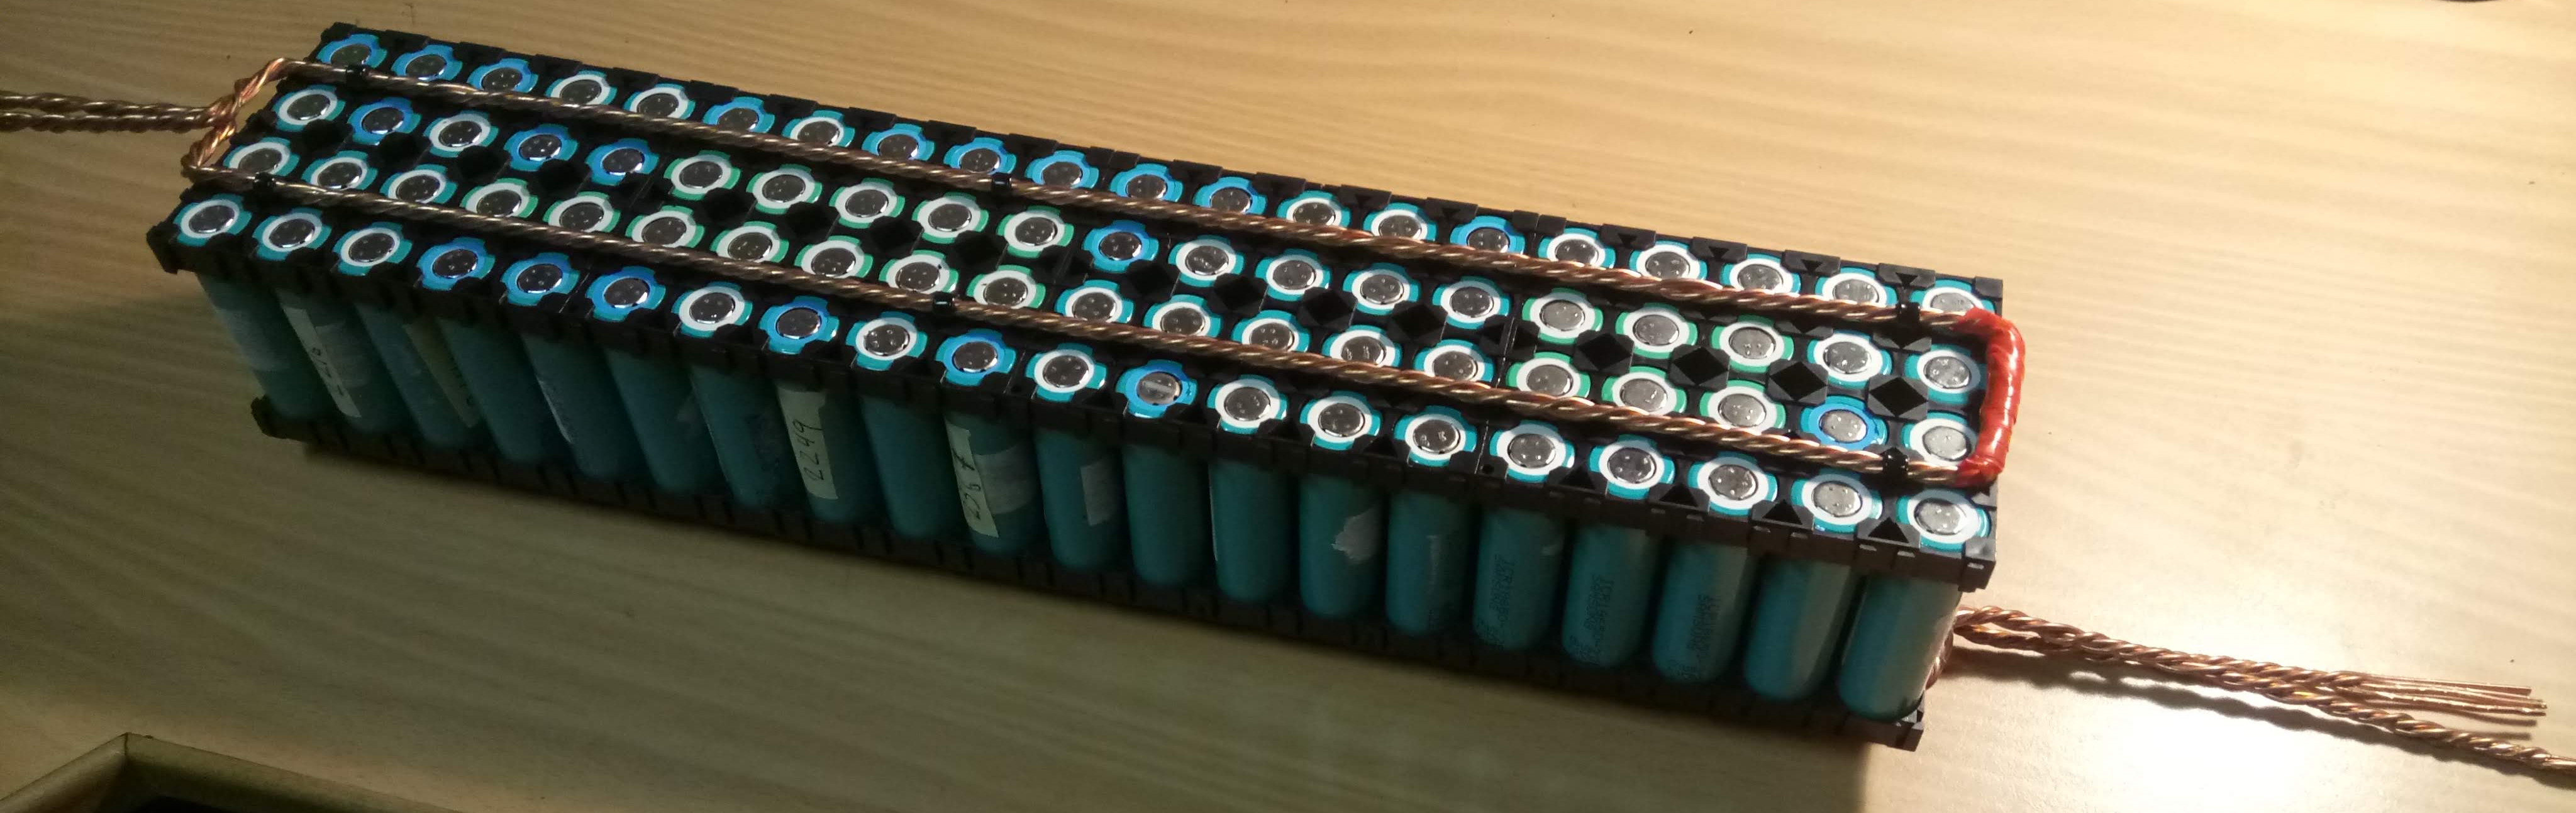
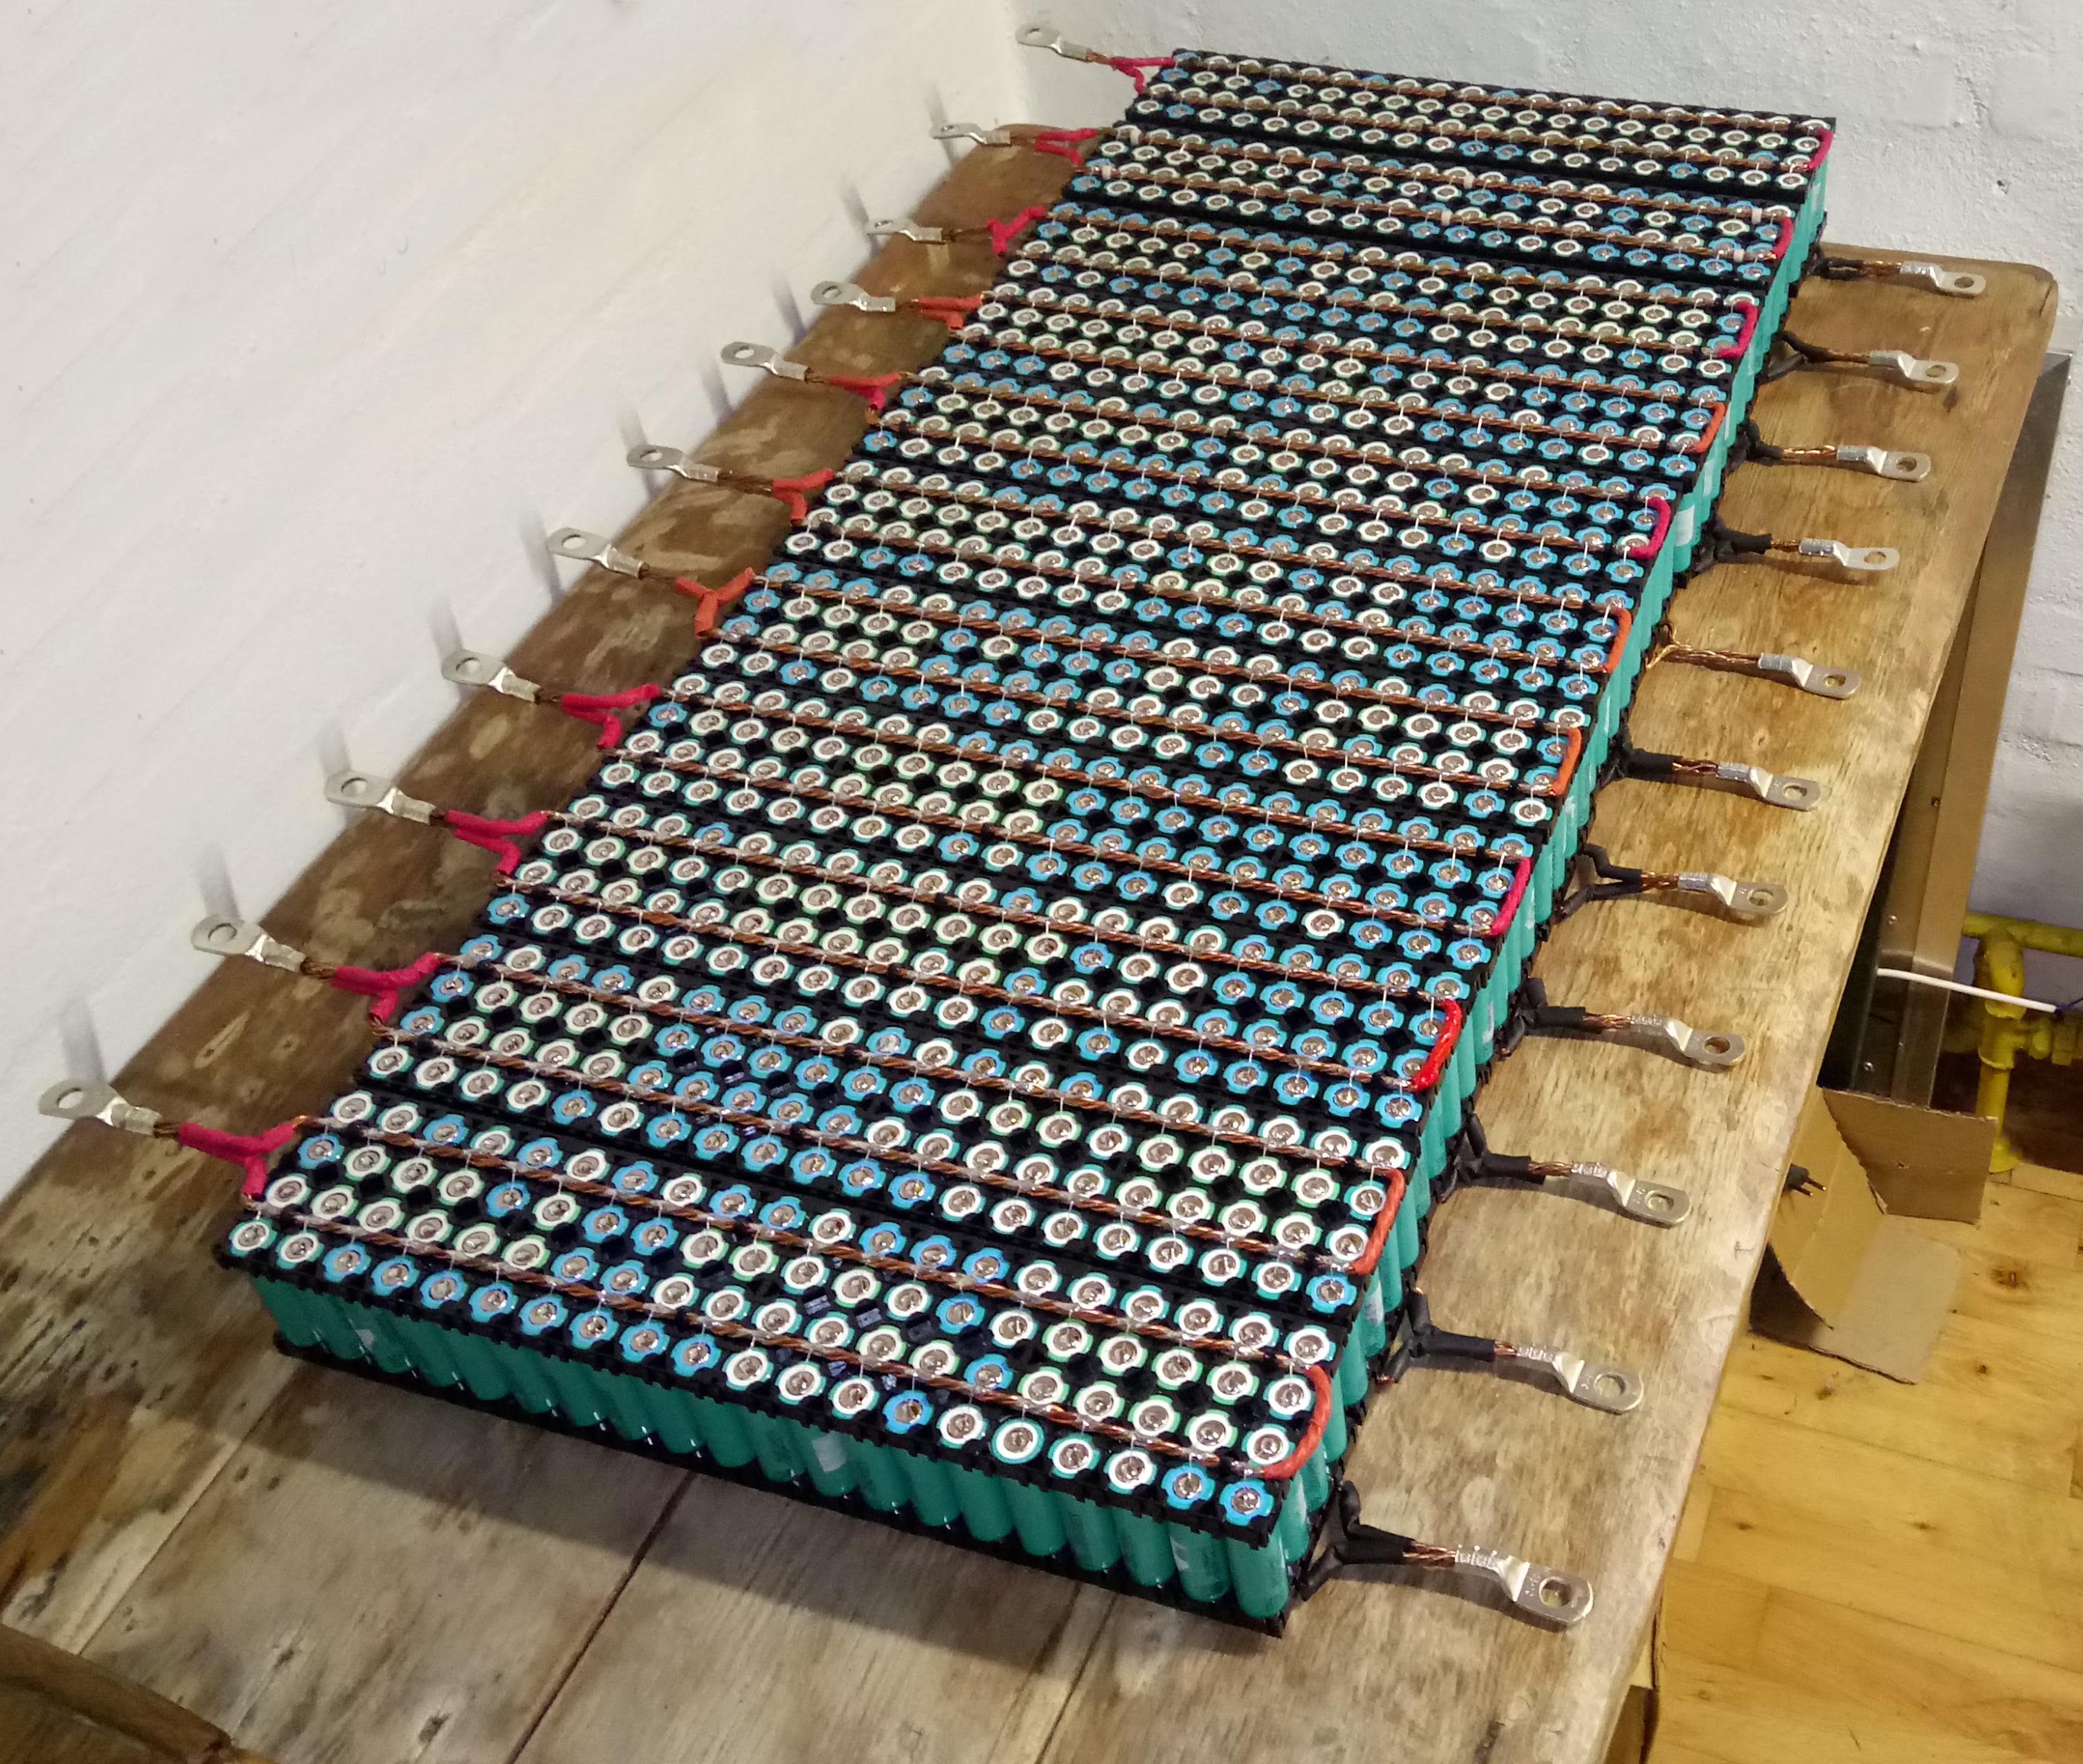
My design will go for 14 of these packs in series, for a nominal 48V system.
I wanted a design that was:
- Very hard to short circuit, individual cell fuses, and generally as safe as possible
- Mechanically stable
- Balanced as much as possible
- Expandable
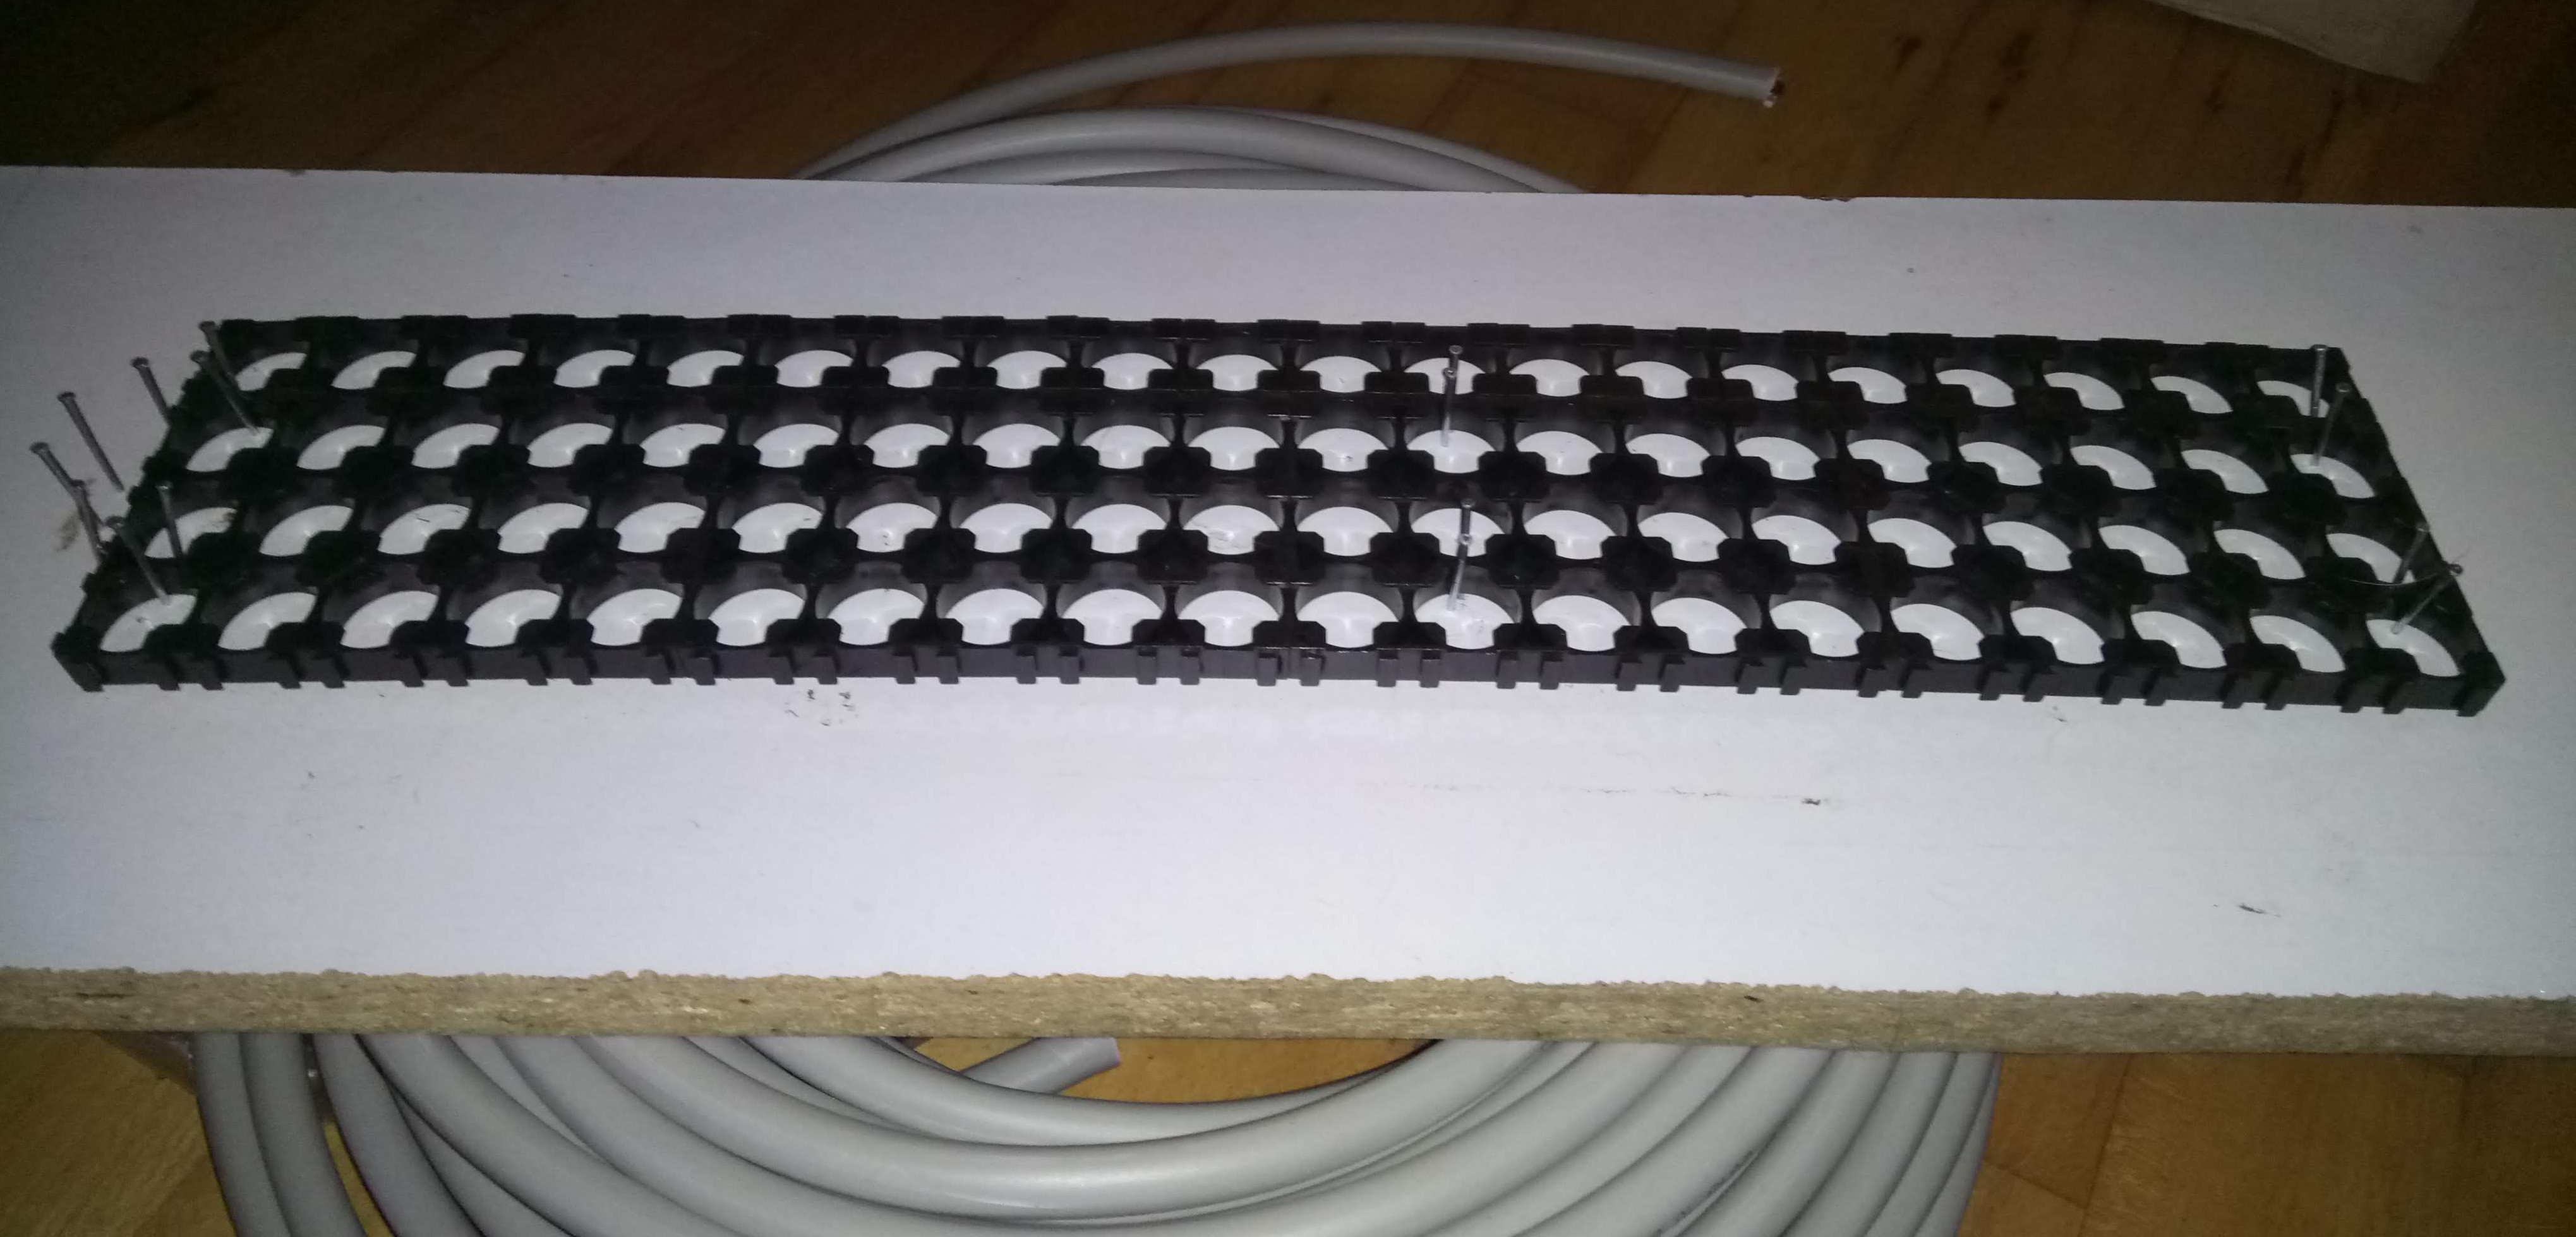
The design is basically 4 4×5 18650 holders for the top and bottom. The cells I used were all tested for capacity (all above 2000 mAh) and self-discharge (all above 4,1V after several weeks/months), and are all Samsung cells. When assembling the packs I tried to mix the cells as much as possible: this should mean that on average the packs will be approximately the same capacity.
The packs have all the positive metal on the top, and the negative on the bottom. This means that any metal would have to touch both the top and the bottom, to short circuit the pack; this is not possible with a straight piece of metal. The connectors are going out on each side: if they went out the same side it would be possible to short-circuit them. Also, this will ensure that all the cells are discharged at the same rate: if they went out the same side the cells closest to the connectors would be loaded harder than the ones further away. This layout will not be a problem when they are put in series, they will just be alternating up-down. The busbars are shrink-wrapped on both ends, so only the connector is connected.
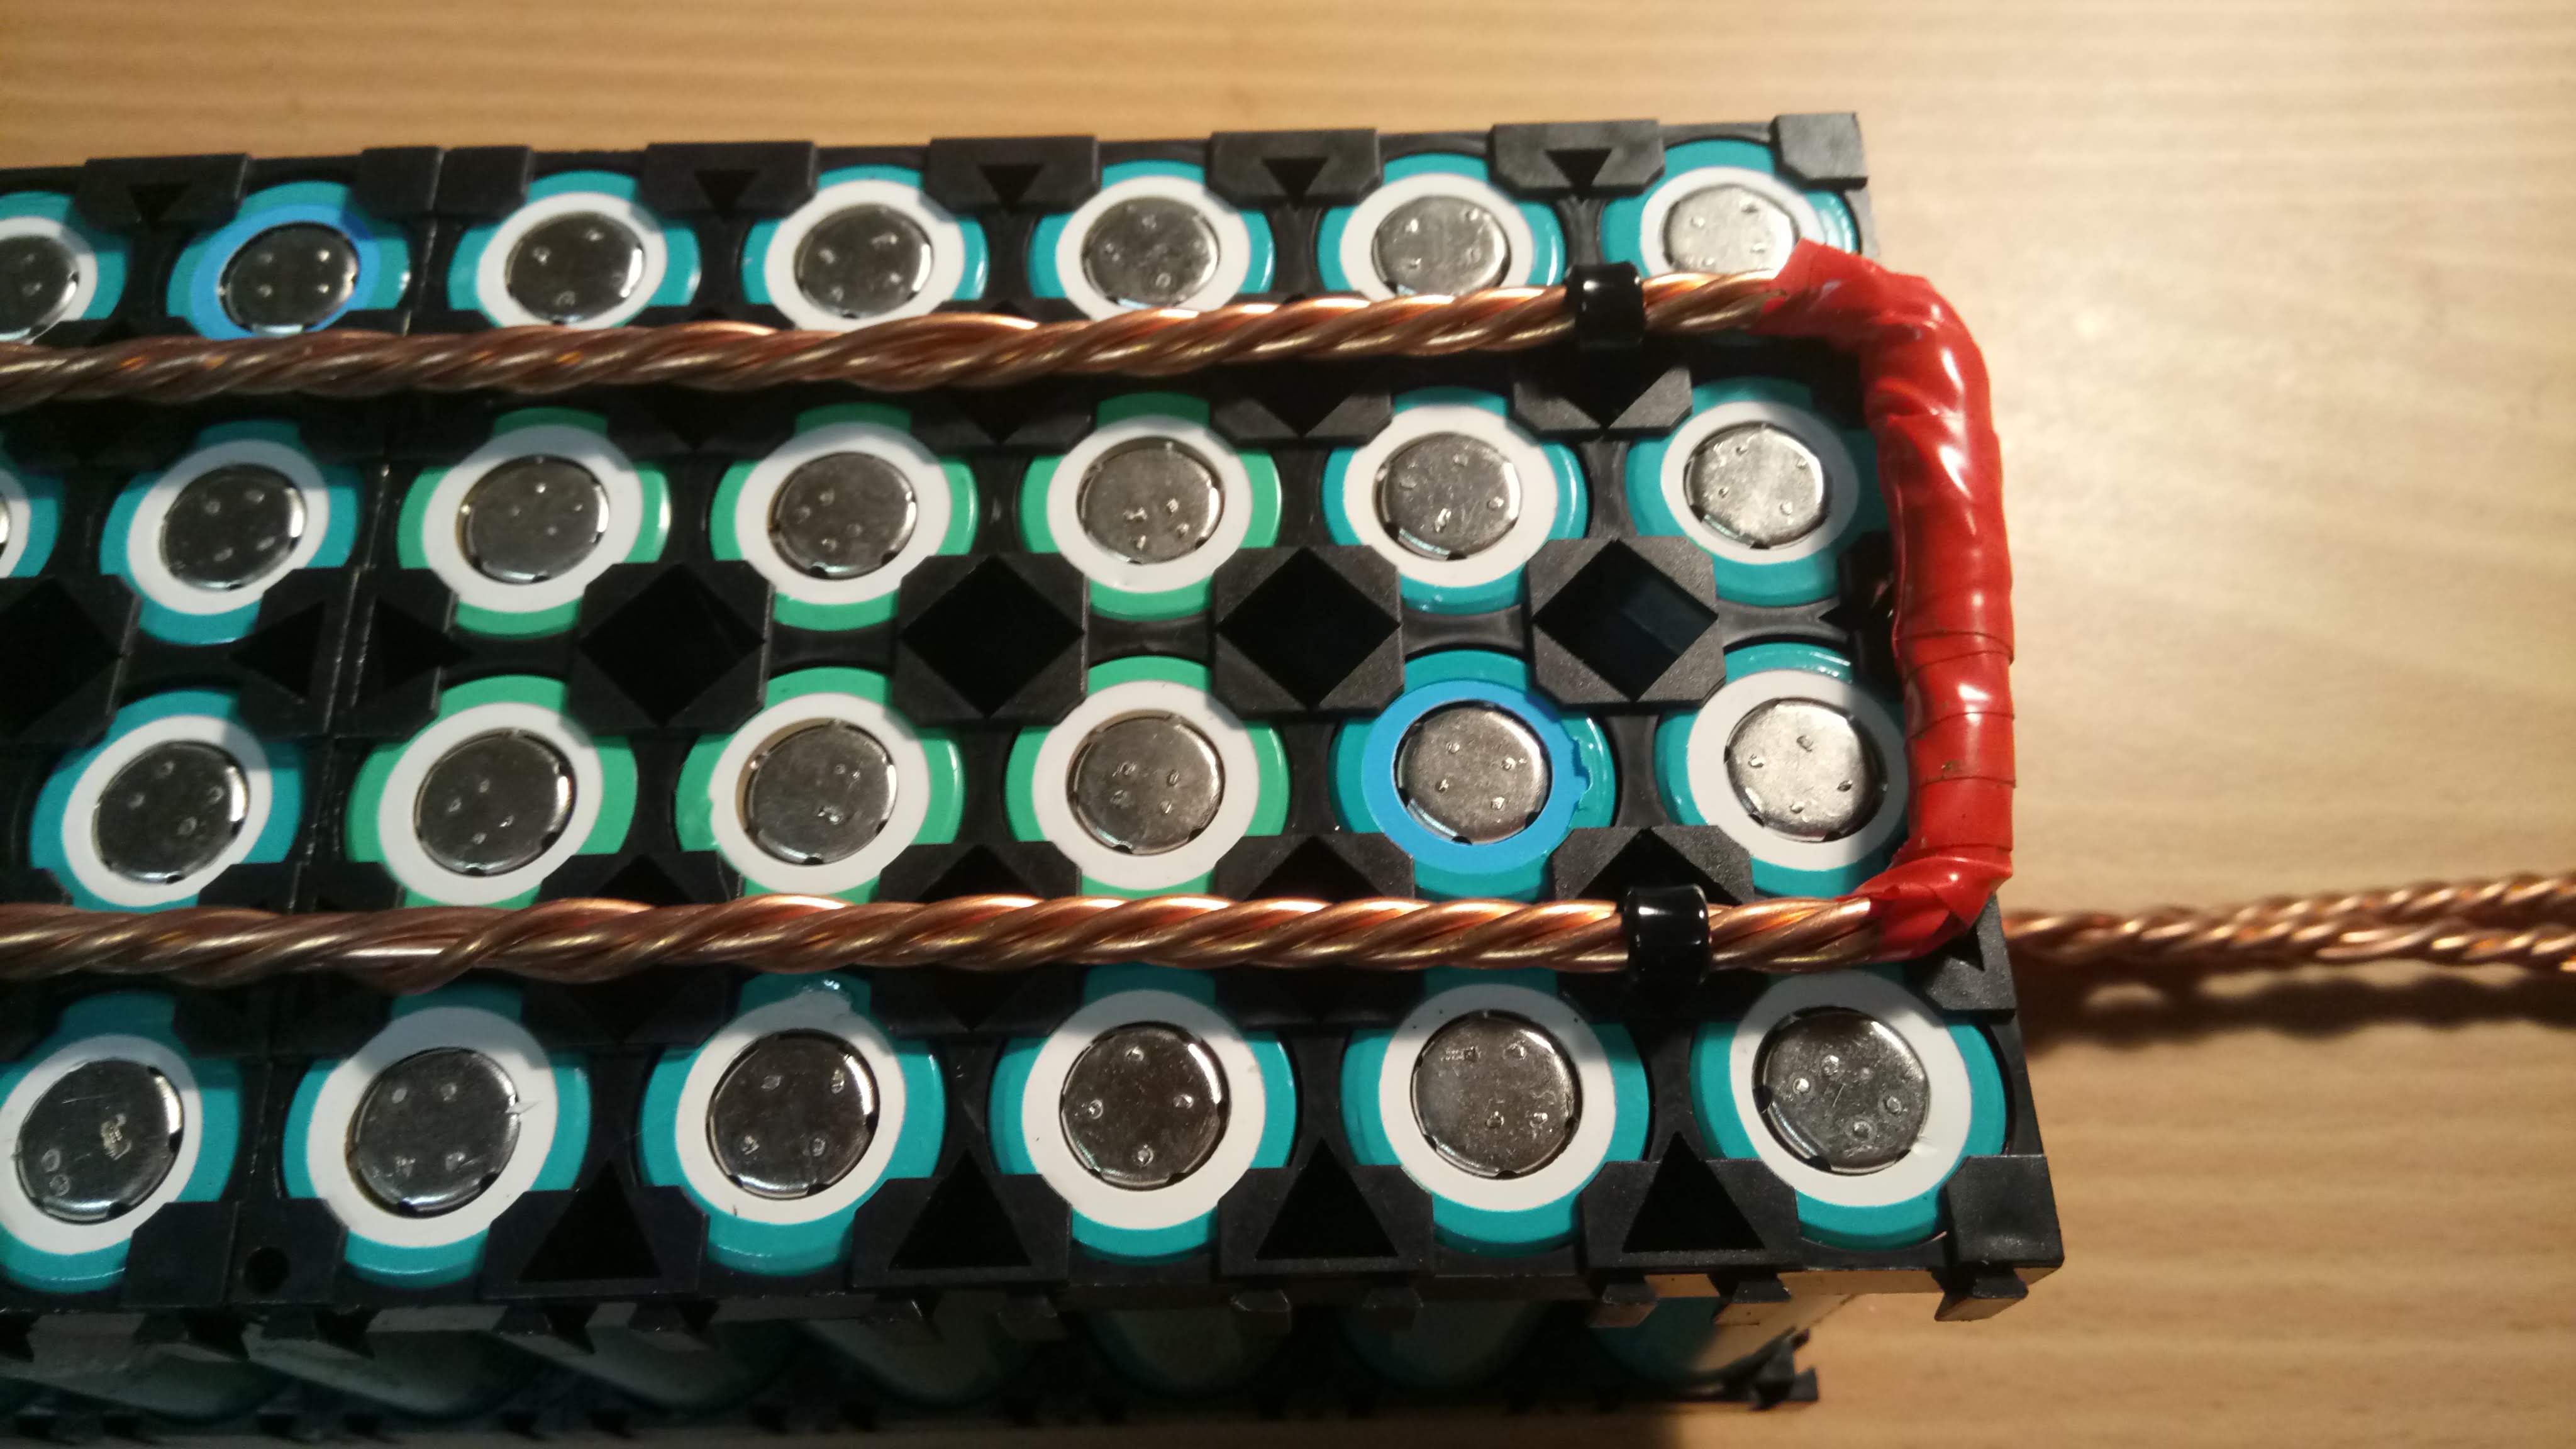
This means that the packs are impossible to short-circuit by themselves.
The packs are held together by 6 zip-ties: 2 at each end, and 2 in the middle. 5mm holes are drilled in the holders. The zip-ties go through the packs and around the busbars on each side.
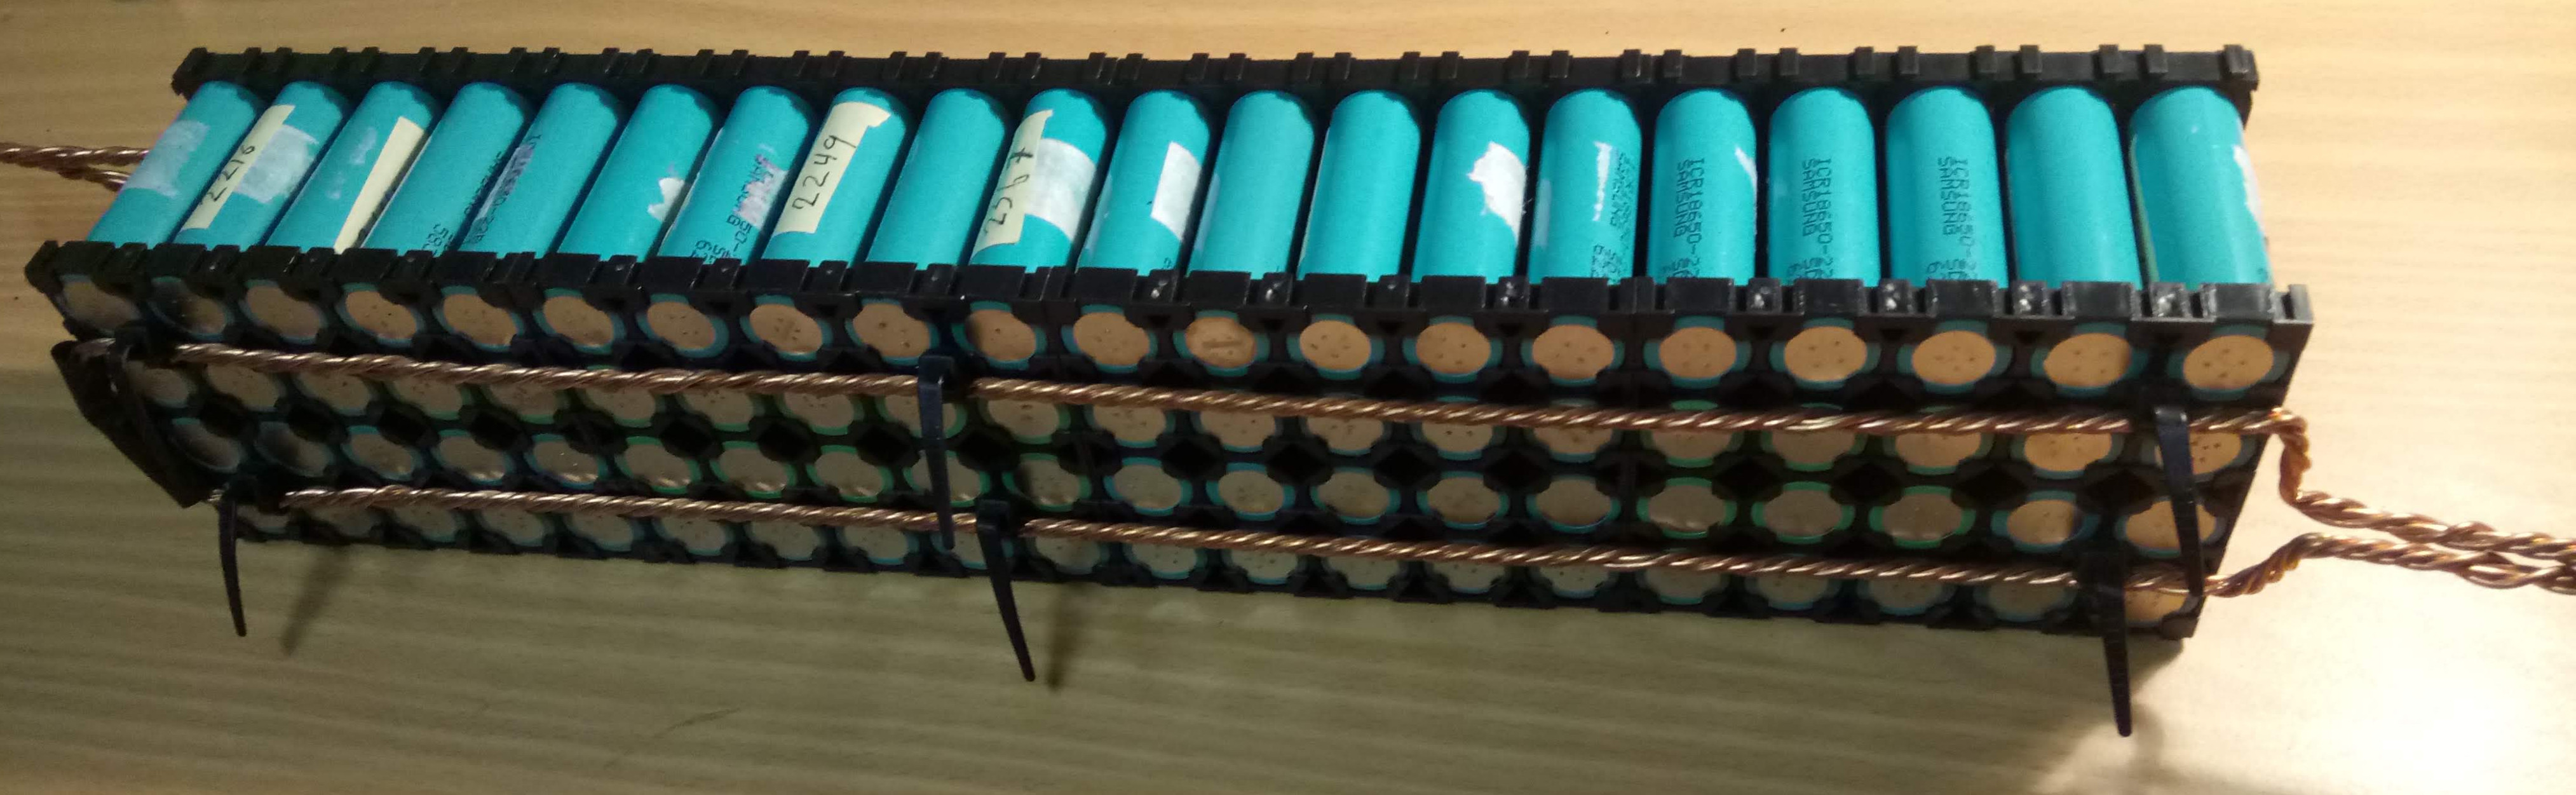
The busbars are 4 wires of 2.5mm² wires, that are extracted from a standard AC cable. They are twisted together using a bench vise, and a cordless drill. They are then pre-bent using a template.
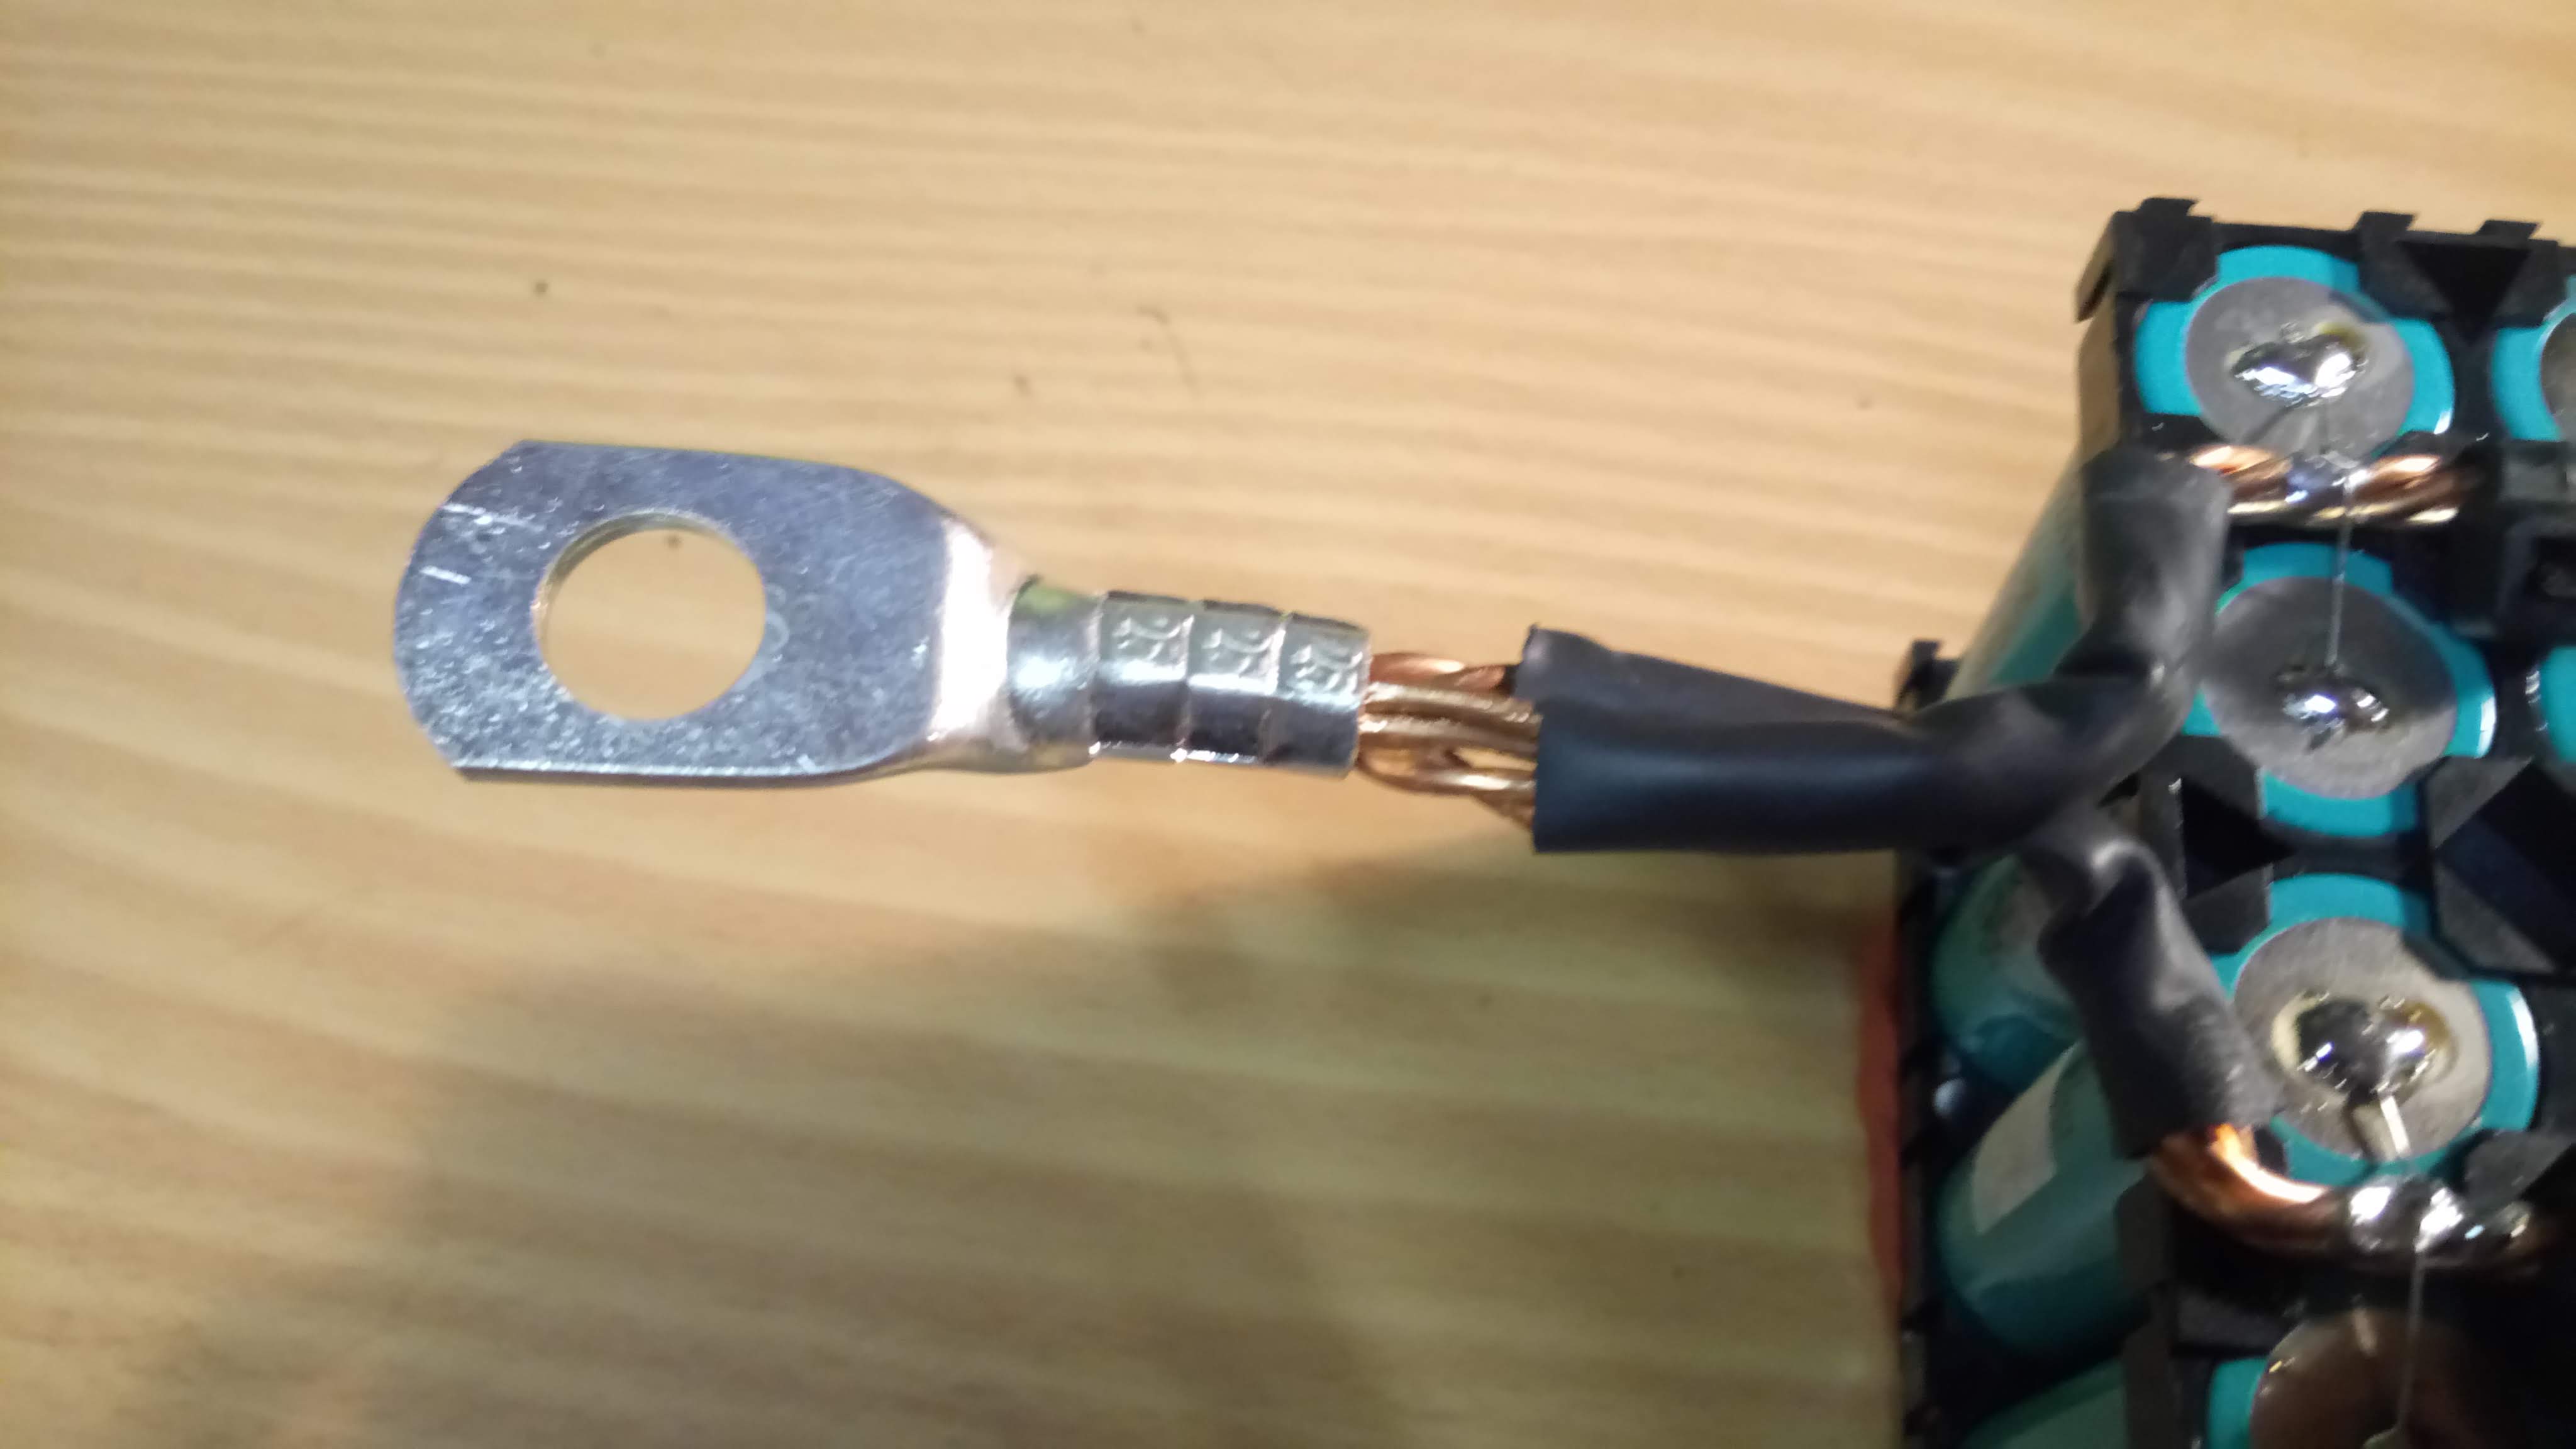
The connectors are 25mm² cable lugs. The two ends of the busbar go into the lug, meaning 8 wires of 2.5mm², or 20mm² in total. Depending on the exact calculations, this should be good up to 80A-160A. I intend to load the packs with at most 80A, and normally much less, so this should be fine.
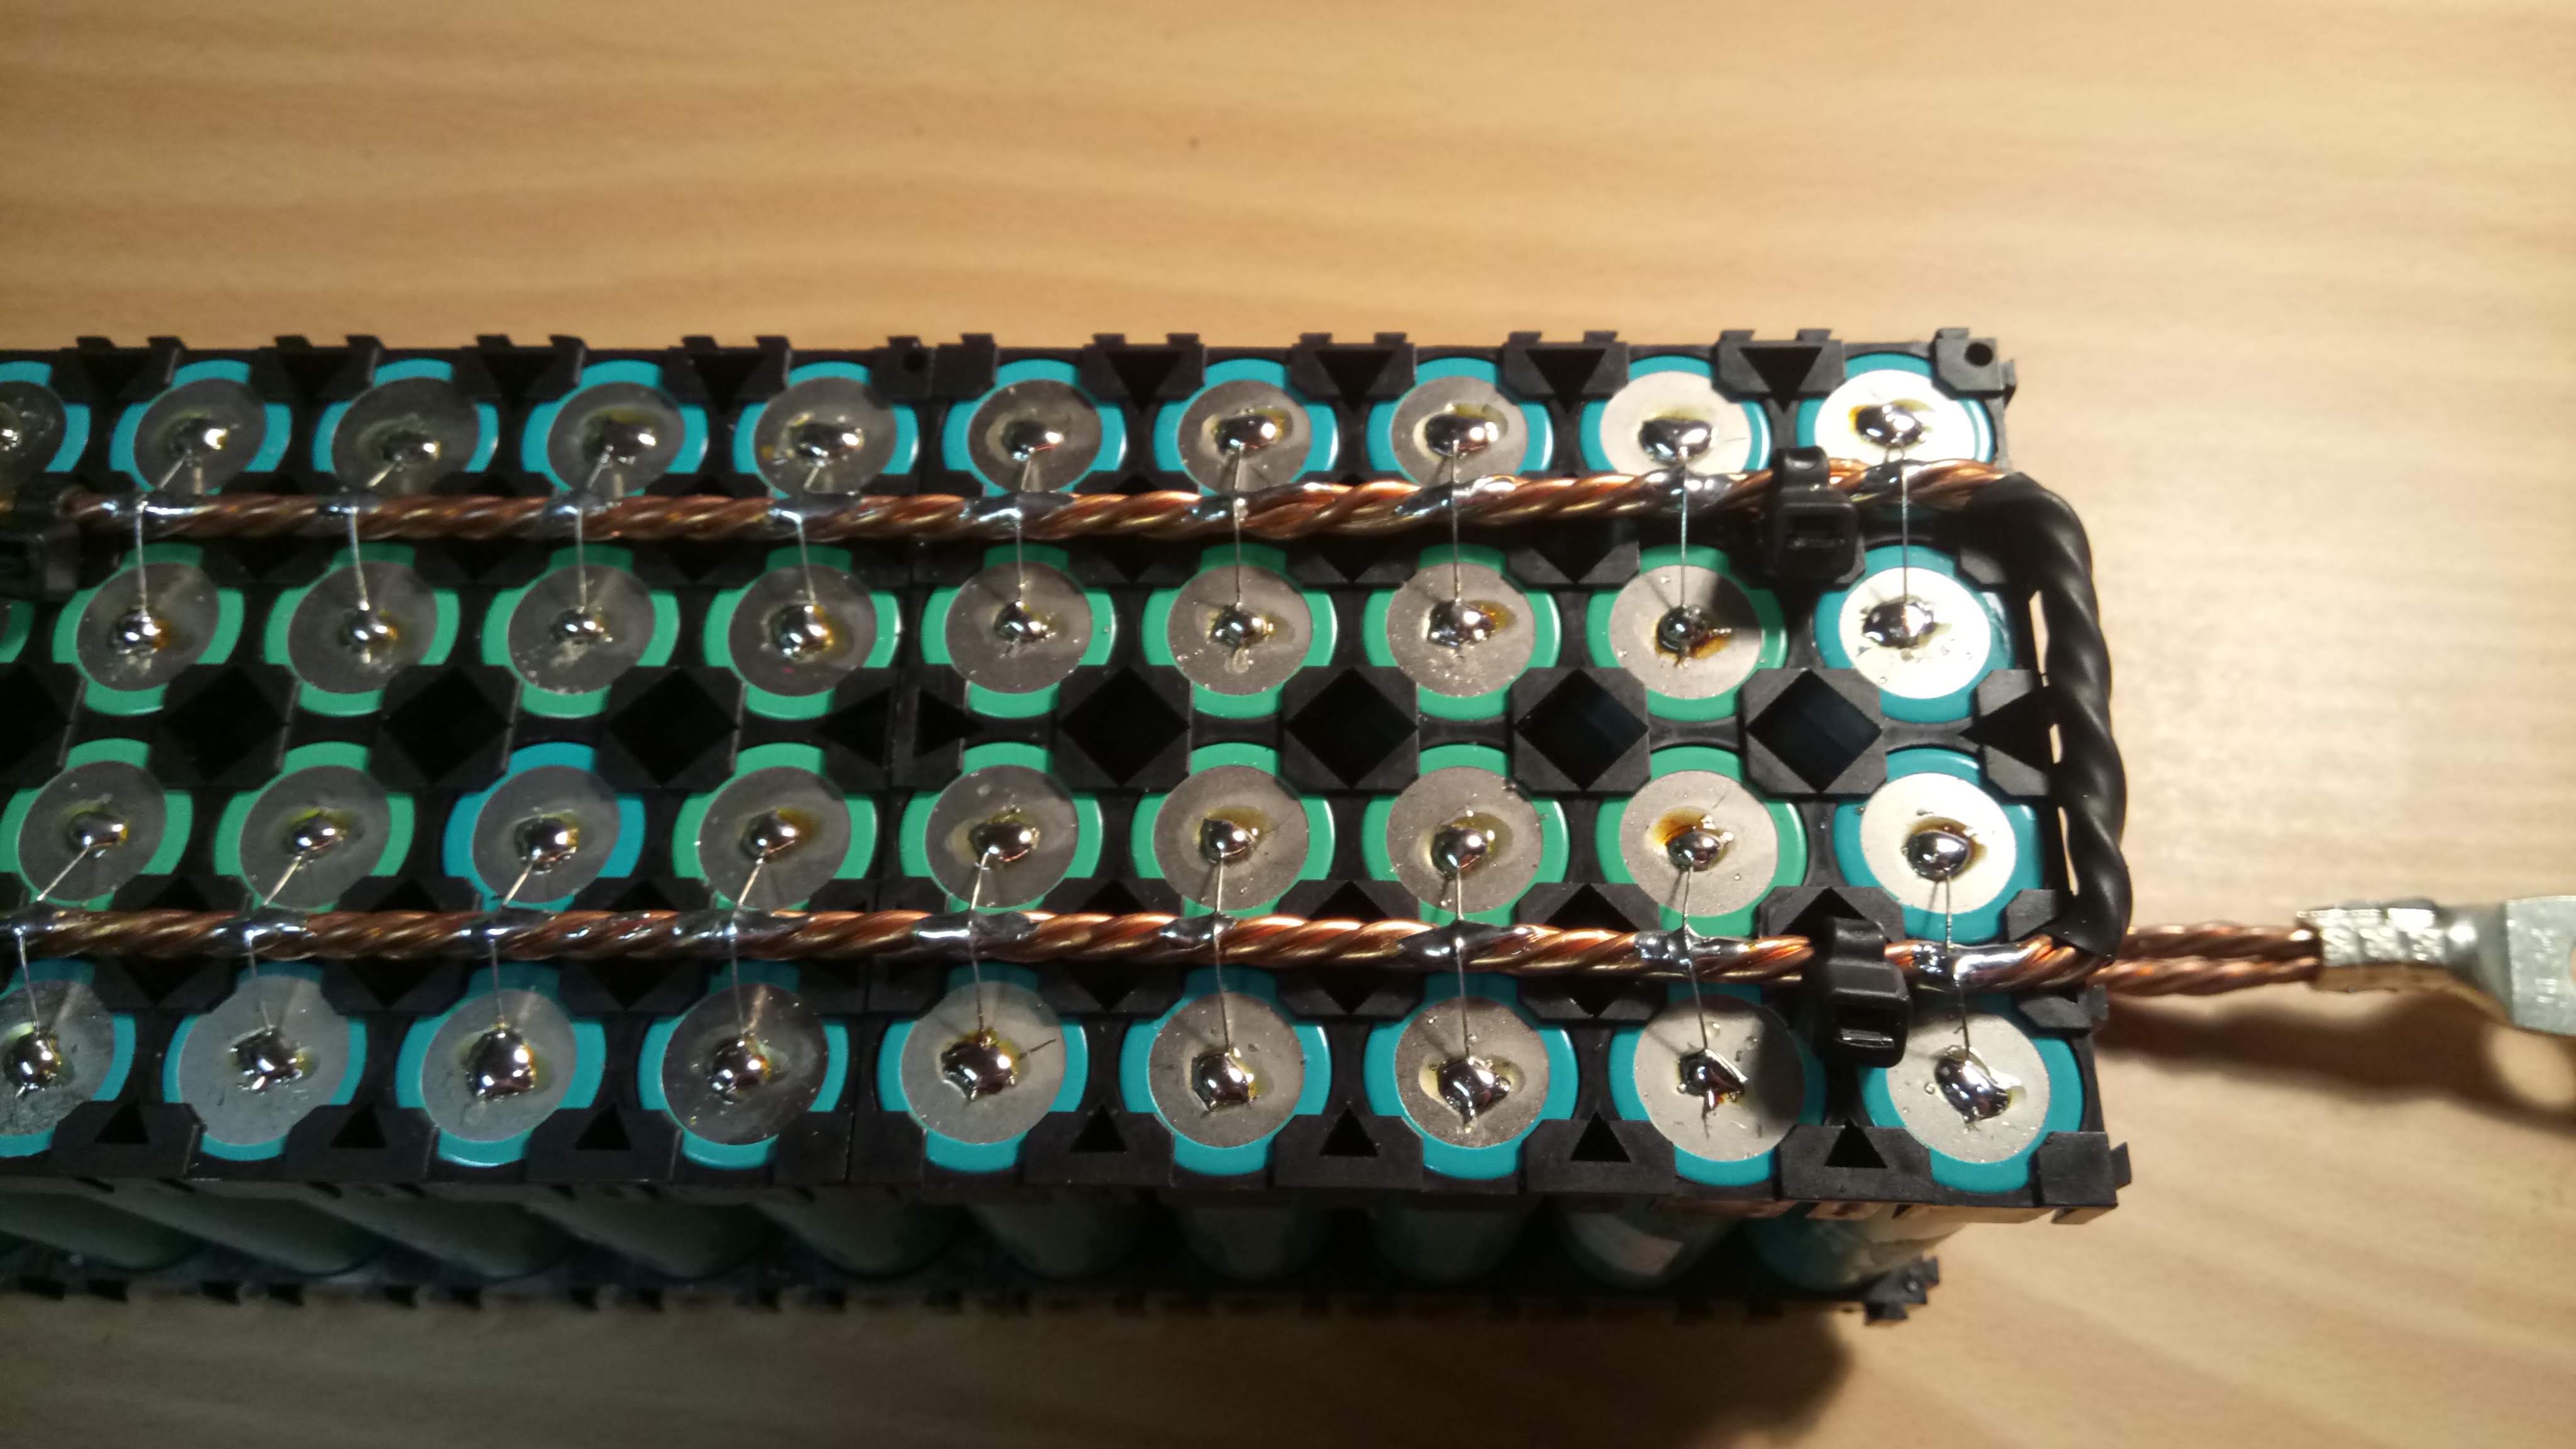
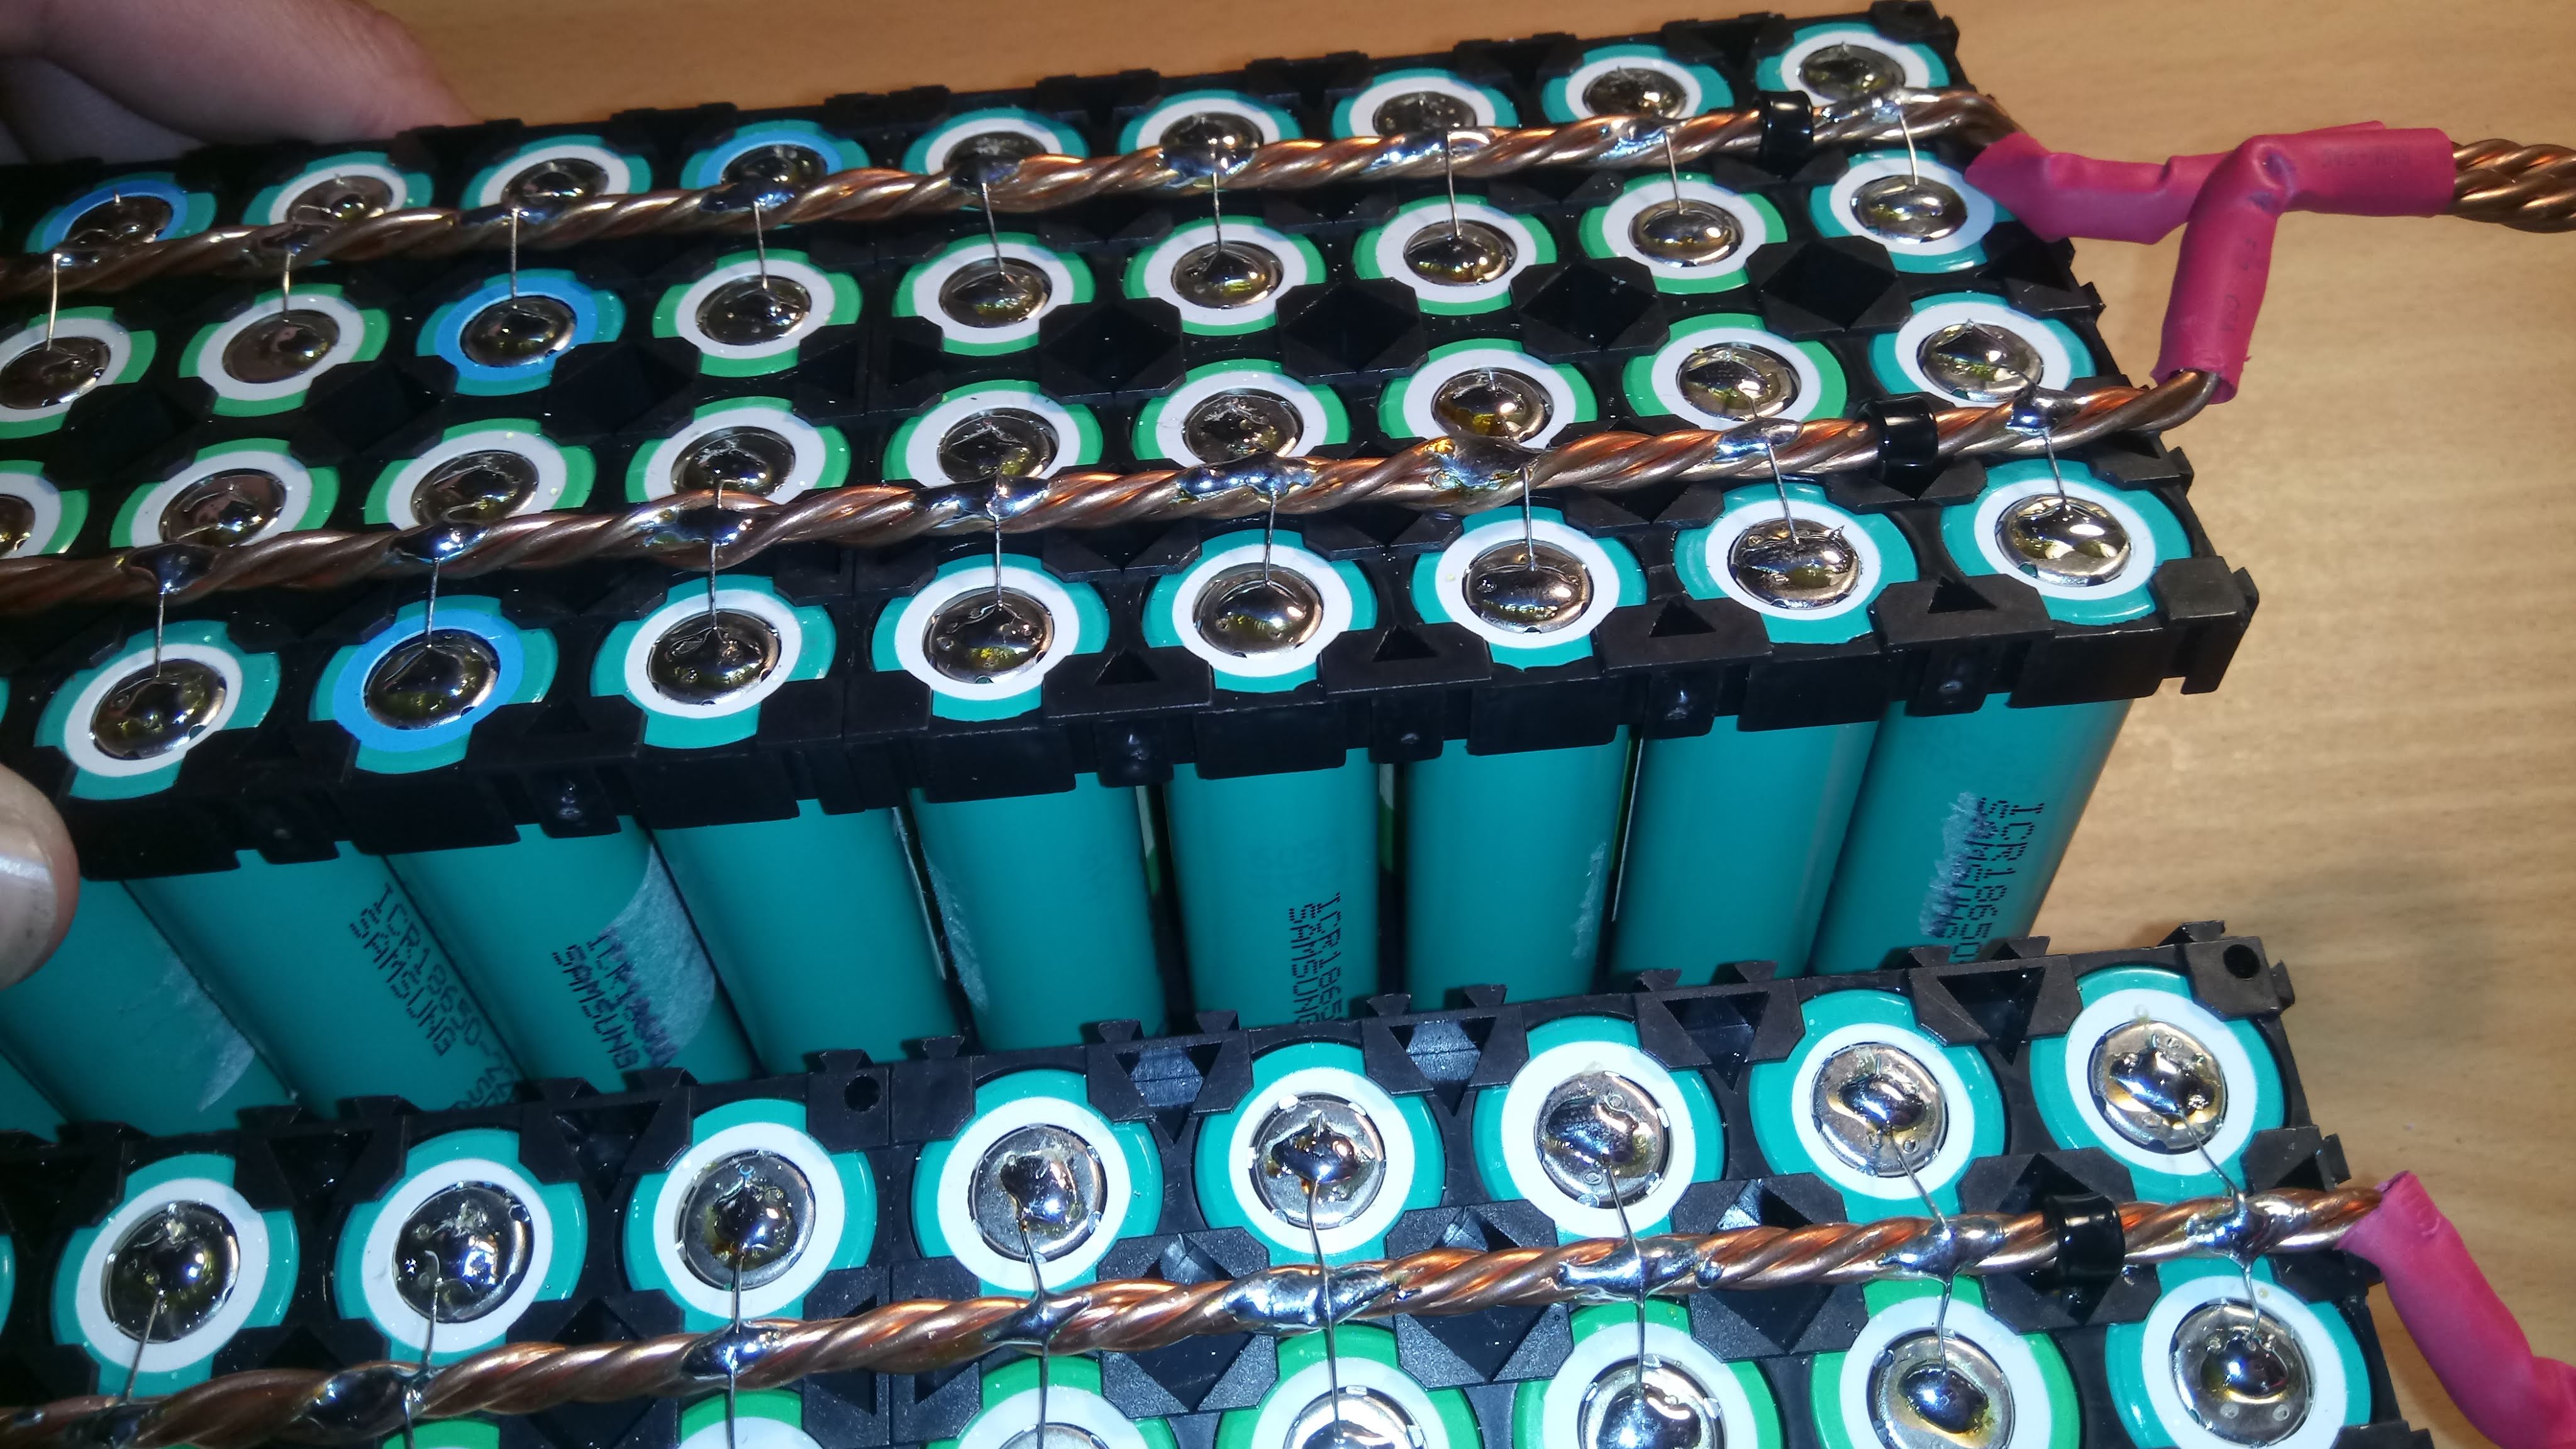
The cells are connected to the busbars by fuse-wires. I used legs from 1/8W resistors, from a batch I tested beforehand. The resistor legs blows at 5A after some time, and in a few seconds at 6A. This should be well within spec, since the fuse-wires are mainly intended to isolate cells that go short-circuit: in this case the other 79 cells will be delivering current to the one bad cell, and the fuse wire should blow very quickly. This is another reason to not build too small packs: you need enough current available that the fuses will blow quickly.
The fuse wire is soldered to the cells, and soldered to the busbars. I used good lead-based solder, I tried crappier and lead-free solder but the results were poor. The positive side is soldered at about 340C, while the negative needs a bit more heat at 350C. For soldering to the busbars I go up to 380C, and move around in a circle since heat management is very much needed.
One concern I have heard from several people is that the cells are losing capacity by soldering. I did a test by soldering a few cells, and leaving a few control cells unsoldered. Then I capacity tested all the cells for a few cycles to check if any capacity is lost. I was unable to find any capacity loss on the soldered or unsoldered cells, so for me that is “myth busted”.
The packs are prepared for a future extension to 1s160P or similar. The holders are all oriented in the same way, and in such a way that 2 80P packs should be able to click together side by side:


Each pack (or set of 2 packs if expanded) will get one Batrium LongMon. It should be fully capable of balancing such a system.
If the hivemind has any ideas or things I missed, I’m very interested in hearing about it!
Olimex A20-OLinuXino-LIME2 – A review after 4 years in service
Last week my A20-OLinuXino-LIME2 one board Linux computer quit working, with a power supply issue. I looked up when it was purchased, and realised it had been in 24/7 service for almost 4 years. I guess that is a good excuse to do a little review. It even turned out that it the board was fine, but the AC-DC power supply brick could not supply enough current anymore.
The relevant specifications of the board, for my uses, are basically:
- Dual core 1 GHz ARM Cortex-A7
- 1 GB memory, 1 Gbit ethernet, SATA connector
- LiPo battery connector/charger for UPS functionality
The Lime2 has been tasked with running my home monitoring system, consisting of a Debian installation with a Graphite backend, a Grafana frontend, and a ZoneMinder installation. The Graphite database is running on a software RAID0 of two disks (one on SATA, one on USB): in the beginning it was two spinning disks, but after a few years the random 2.5″ laptop disk I was using crapped out, so it was upgraded to a Samsung SSD. The power budget is strained more or less to the max with two spinning harddrives: The system was only able to boot if the battery was connected, presumably because the voltage would otherwise drop for the startup torque. This problem went away after switching to a SSD.
Software wise the system started out with the Debian supplied by Olimex on a SD-card, a Debian pre-Jessie with a custom SunXi kernel. This system was reasonable, but did experience random hangs after some time of use (I belive I found a bugreport back in the day, but am unable to refind it now). The system was later upgraded to a Debian Stretch with a 4.9 kernel from stretch-backports, that supports the SunXi chipset enough for my uses. The upgrade was rather involved, requiring the correct kernel image, a custom U-boot script and the correct device tree file. Something did of course go wrong, at which point I got to be familiar with the serial console of the Lime2: there is a convenient 3 pin header, that gives access to a TTL serial. Using the serial console, I was able to identify the mistake and correct it. After the upgrade the system has been rock-stable.
The system has been handling the load reasonably: The 1GB of memory is constraining, there is not really any more free memory. The processor is only really strained by the motion detection in ZoneMinder, which uses more or less one core per camera. This will hopefully be optimized a bit, as ZoneMinder is being optimized for the ARM instruction set. Handling only the Graphite/Grafana load would be a breeze, even though the system is receiving ~650 metrics per minute.
All in all, I can recommend the Lime2 board for applications that need a little more umph than a Raspberry Pi, notably on the SATA and Ethernet side, and/or applications that need to be continuously available even after the power cuts out. For applications that need more than one SATA port, or more than one Ethernet port, or on-board Wifi, there are better — and more expensive — options. The price point of 45 EUR + VAT (which did not change from 4 years ago) puts the Lime2 slightly above the price of a RaspberryPi or BananaPi, but below boards like the Apu2. In addition, Olimex has announced that the Lime2 will be available “forever”, making any system designed using the Lime2 future proof — for the foreseeable future.
I ordered a new Lime2, before realising the problem was the power supply. I opted for the industrial variant that is now available. The only change, as far as I’m aware, is that the Allwinner A20 chip is rated for a larger temperature range, and it is 5 EUR more expensive.
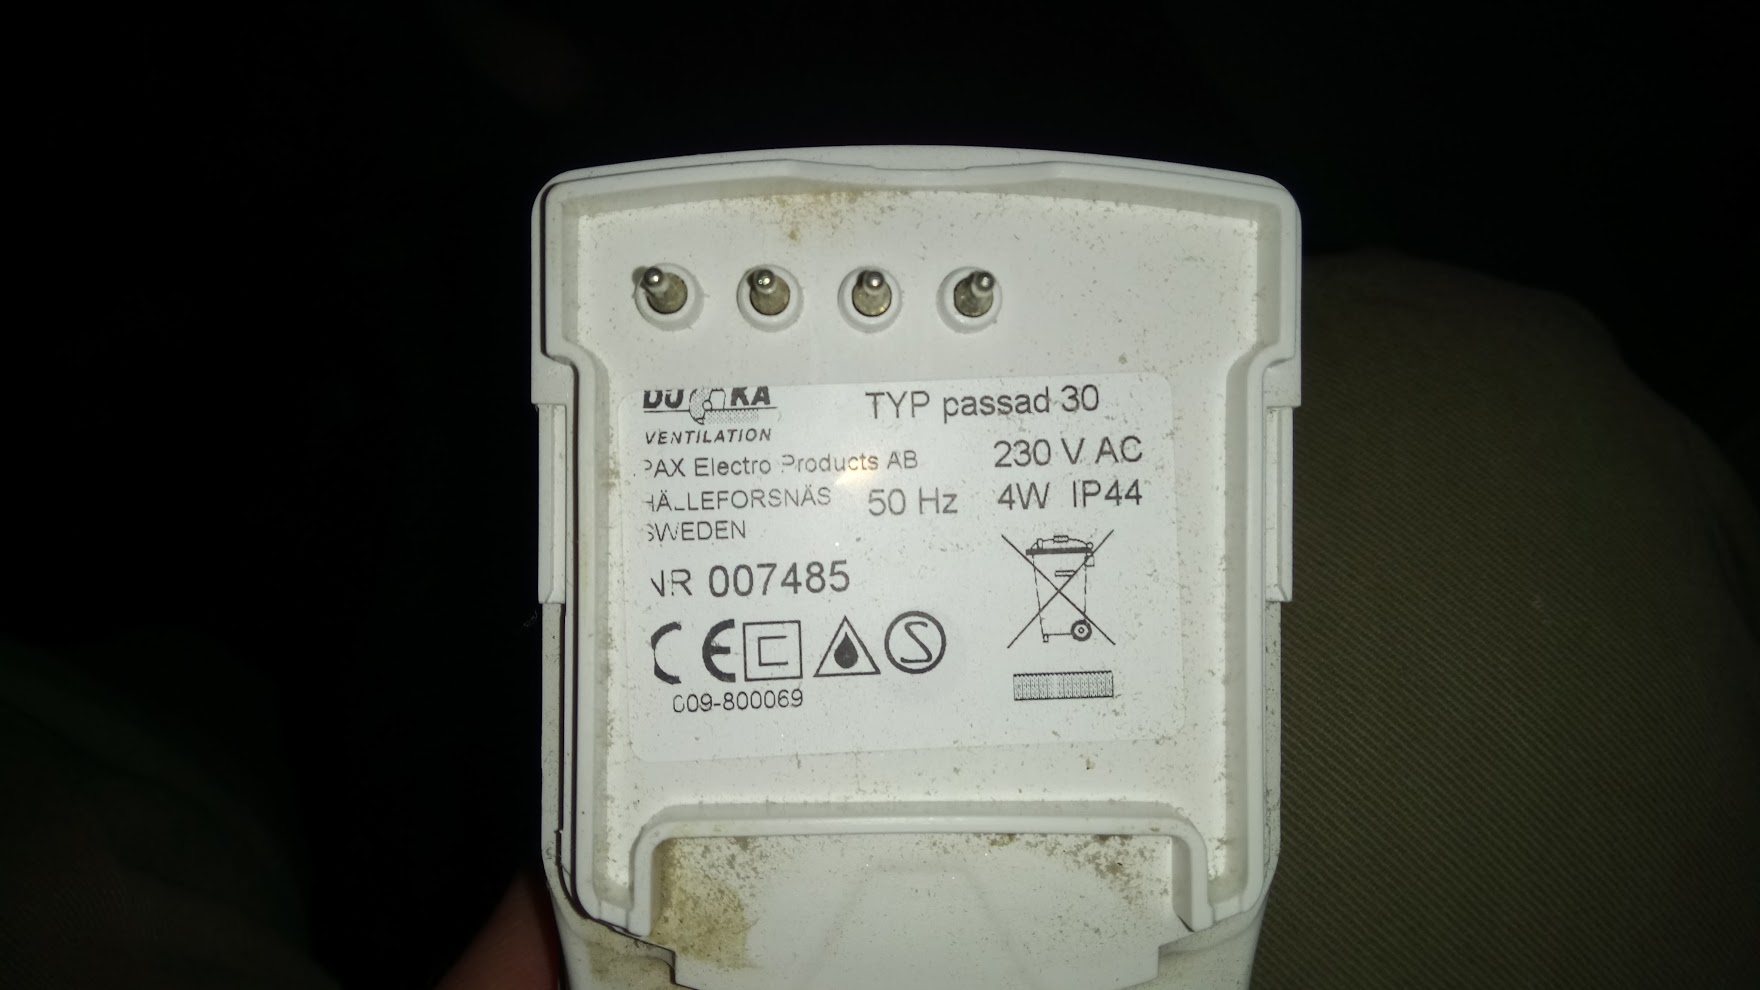
Reparation af DUKA/PAX Passad 30 Ventilator der kører uregelmæssigt
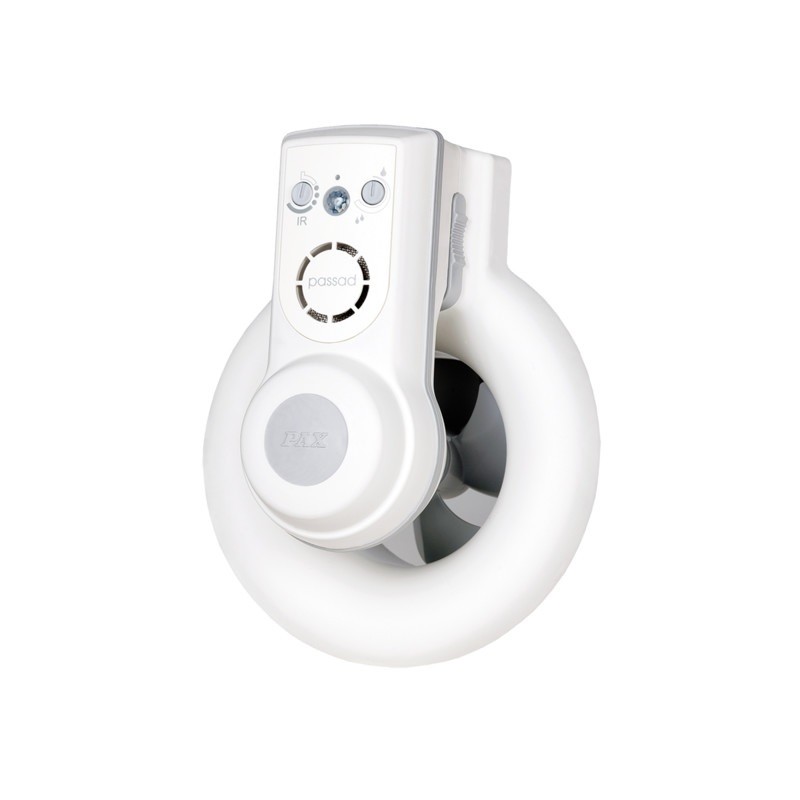
Vores Duka Passad 30 ventilator var begyndt at køre noget uregelmæssigt. Ventilatoren er ellers ret smart styret af fugtighed og IR-bevægelse, men vi bruger den kun fugtighedsstyret. Den var imidlertid begyndt ikke at kunne starte ordentligt: den reagerede fint på fugt, men motoren stoppede efter få sekunder, for straks derefter at starte igen.
Der var jo ikke andet for end at prøve at åbne den og reparere den; en ny ventilator er relativt dyr, og den kunne jo ikke gå mere i stykker end den allerede var.
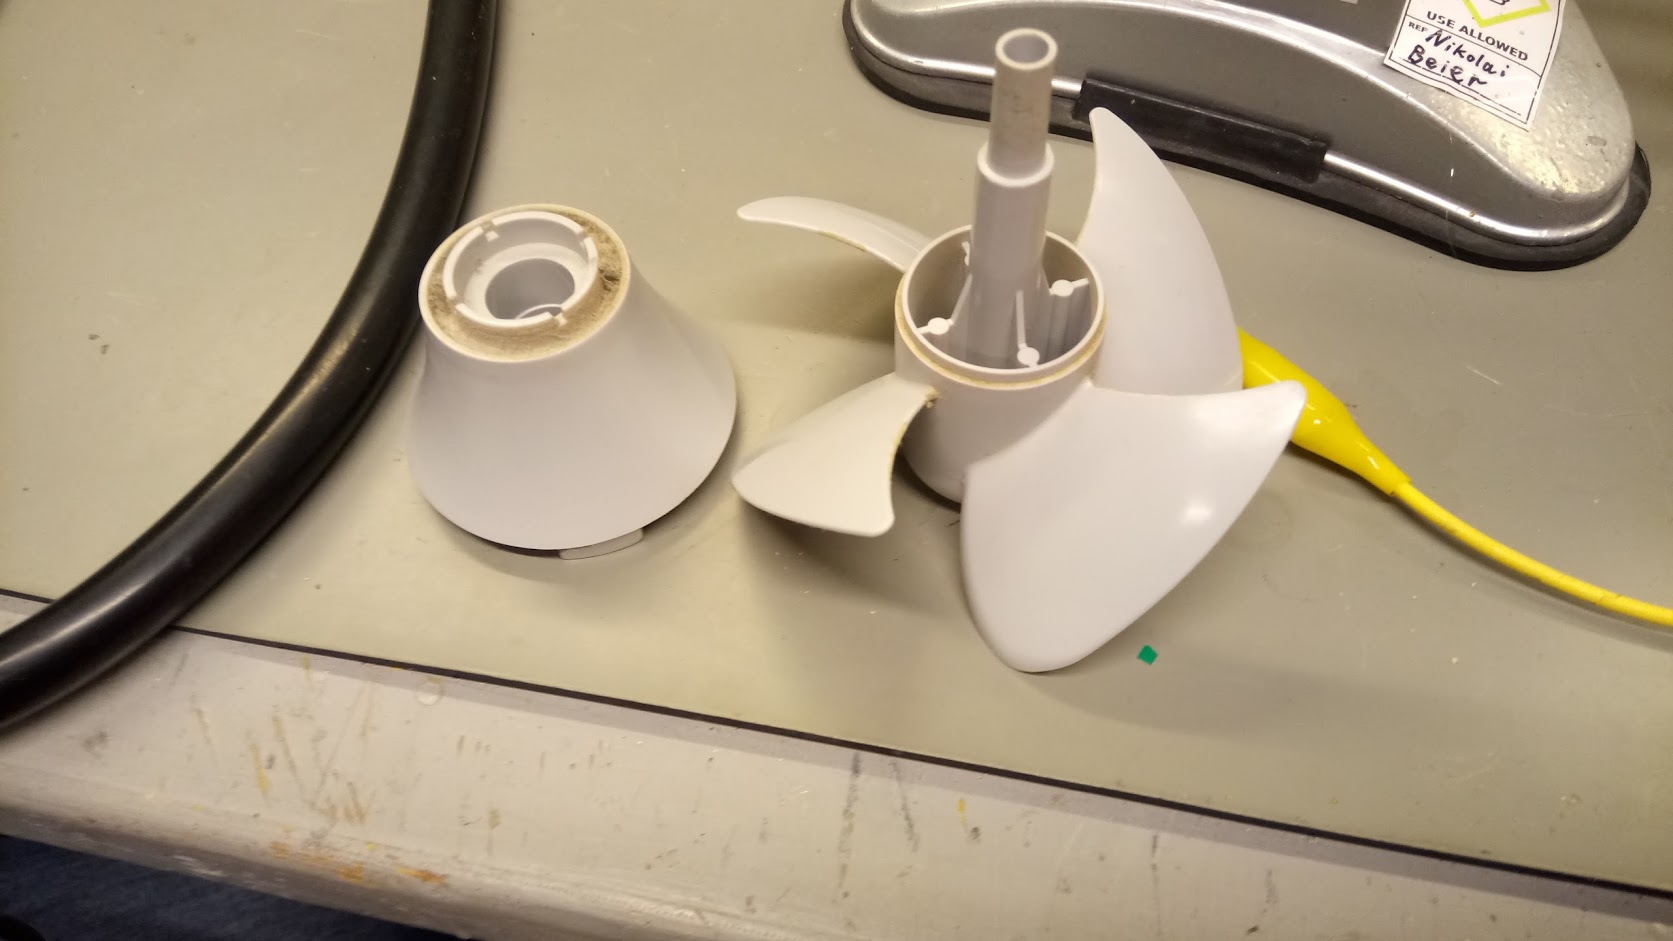
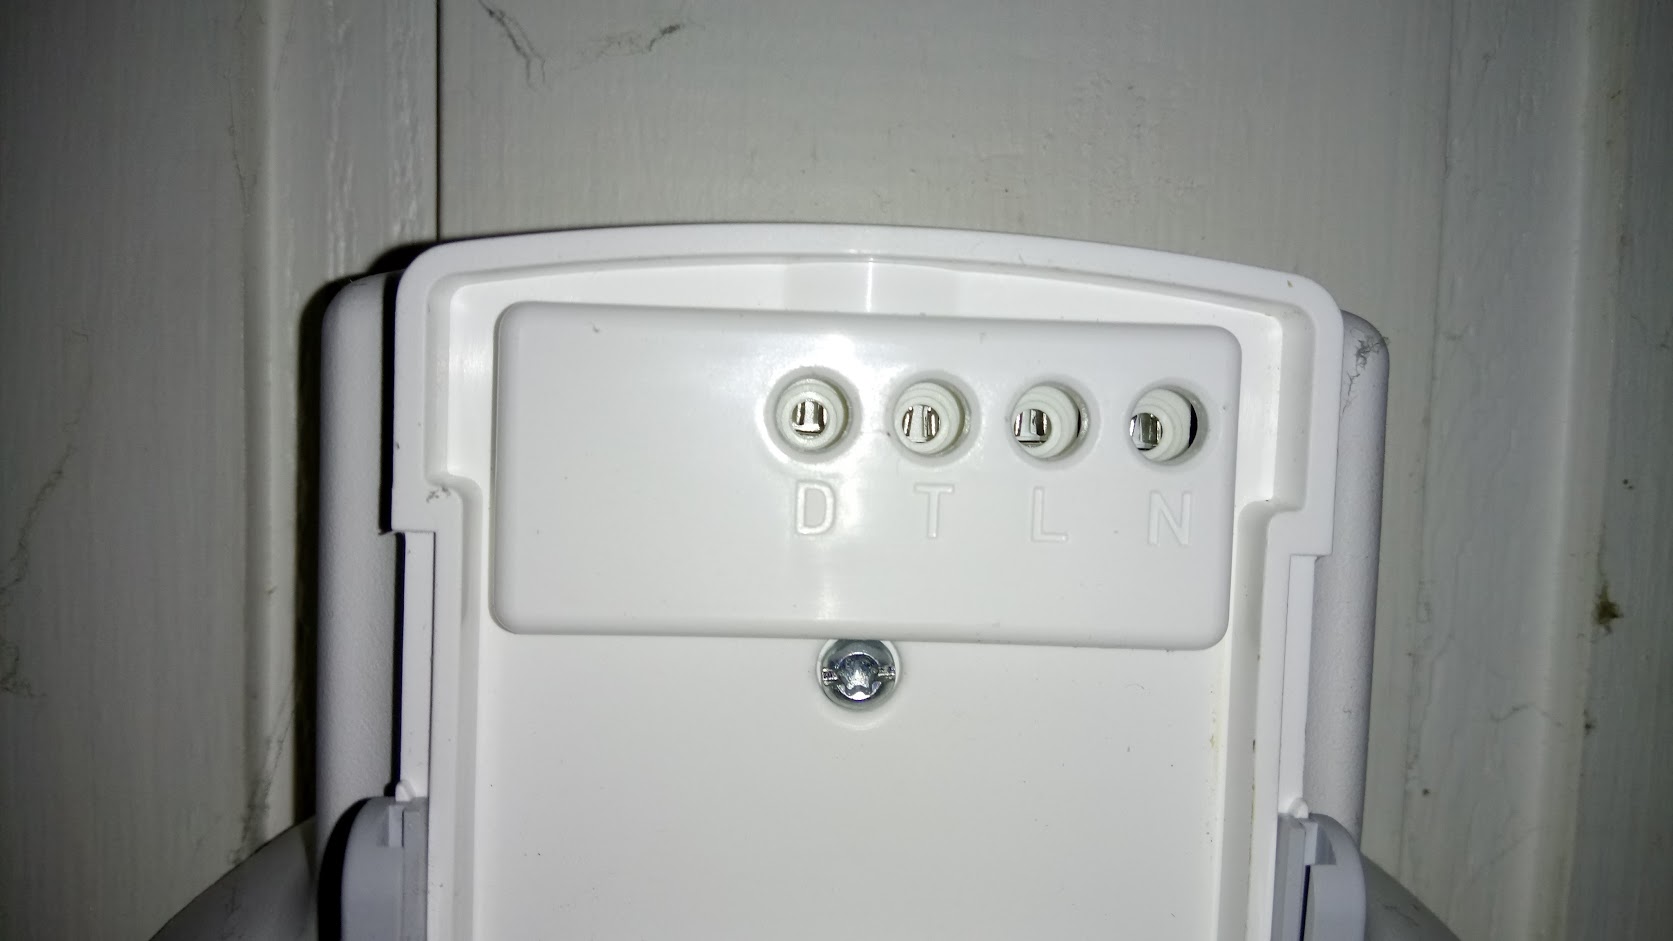
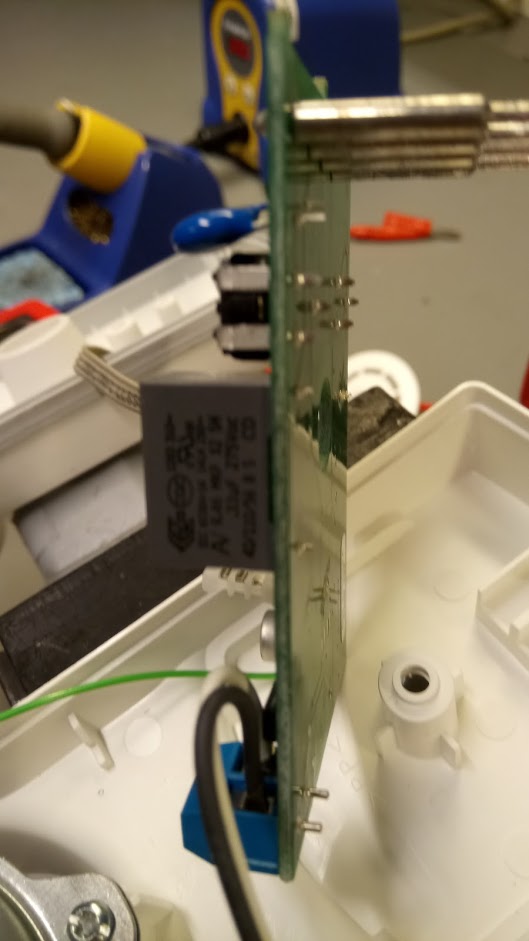
Bladene kan hives af direkte ved at hive op i dem, og tragten kan tages af ved at dreje til siden. Der gemmer sig en enkelt skrue under mærkaten på bagsiden. Inden i er et relativt simpelt printkort:

Den eneste chip er desværre en micro-controller af en art, så hvis den er i stykker er der ikke rigtig noget at gøre. Jeg fik en hel del hjælp i Hal9k til at måle på printet, og det viste sig at strømforsyningen ikke var særlig stabil; ca. når problemet opstod steg spændingen. Vi endte med at lodde en ledning på microcontrollerens GND-ben, og kunne så se at VCC-benet faktisk lå ret lavt ved ca. 3V, og at spændingen der faldt når problemet opstod. Ved at måle tilbage i kredsløbet derfra endte vi helt tilbage ved den store kondensator (0,33 uF) der er næsten først i kredsløbet.
Det er dog ikke så nemt at måle kapacitet med kondensatoren i kredsløbet, men alligevel et forsøg værd: målingen var et godt stykke fra 0,33 uF. Med kondensatoren som hovedmistænkt blev den loddet af, og målt alene: værdien var nærmere et antal nF! Altså var kondensatoren gået i stykker. En erstatning blev fundet i en kaffemaskine fra Hal9k’s Limbo hylde, dog en 0,47 uF, men det burde virke:

Den nye kondensator blev loddet i, og problemet var nu væk! Spændingen ved micro-controlleren lå også stabilt, lige omkring 4,8V. Så var der kun tilbage at samle det hele igen, og sætte ventilatoren til, med lidt penge sparet, og en ventilator reddet fra skrotpladsen. Den eneste forskel synes at være at fugtigheds indstillingen nu skal stå lidt anderledes, men om det er pga. en lidt anden spænding eller bare er tilfældigt er jeg ikke sikker på.
Ford 3000 Tractor Instrument Voltage Stabilizer – Mechanical PWM!
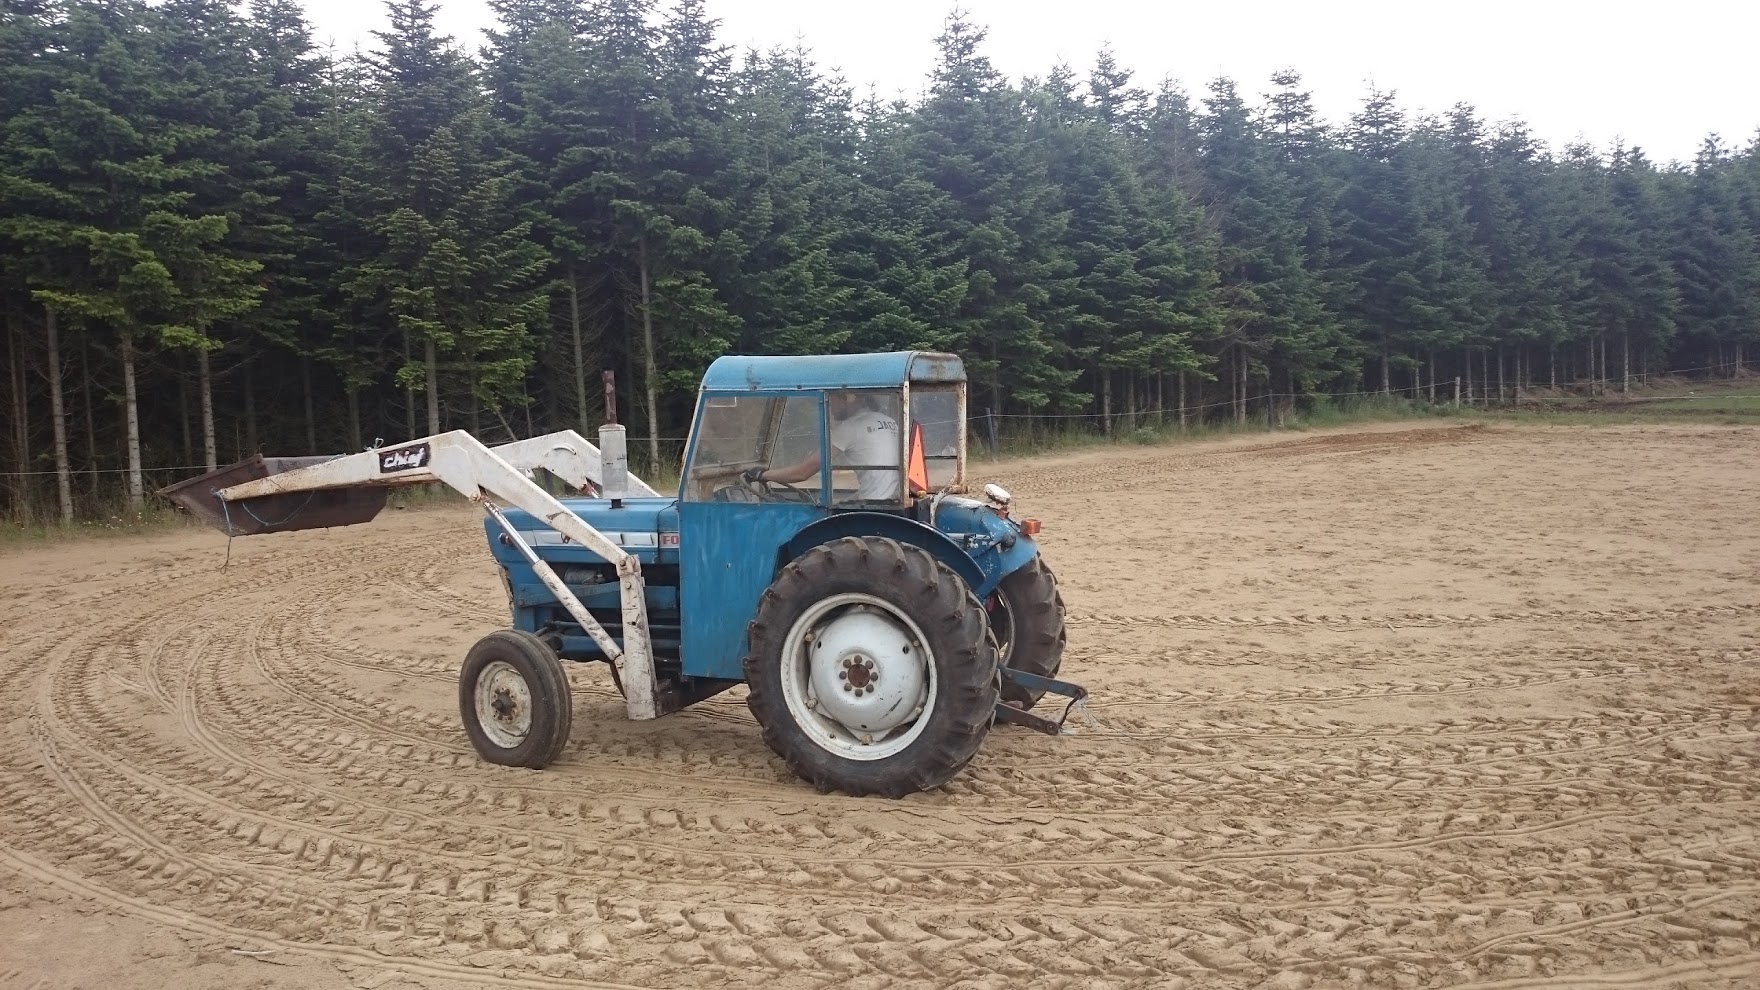
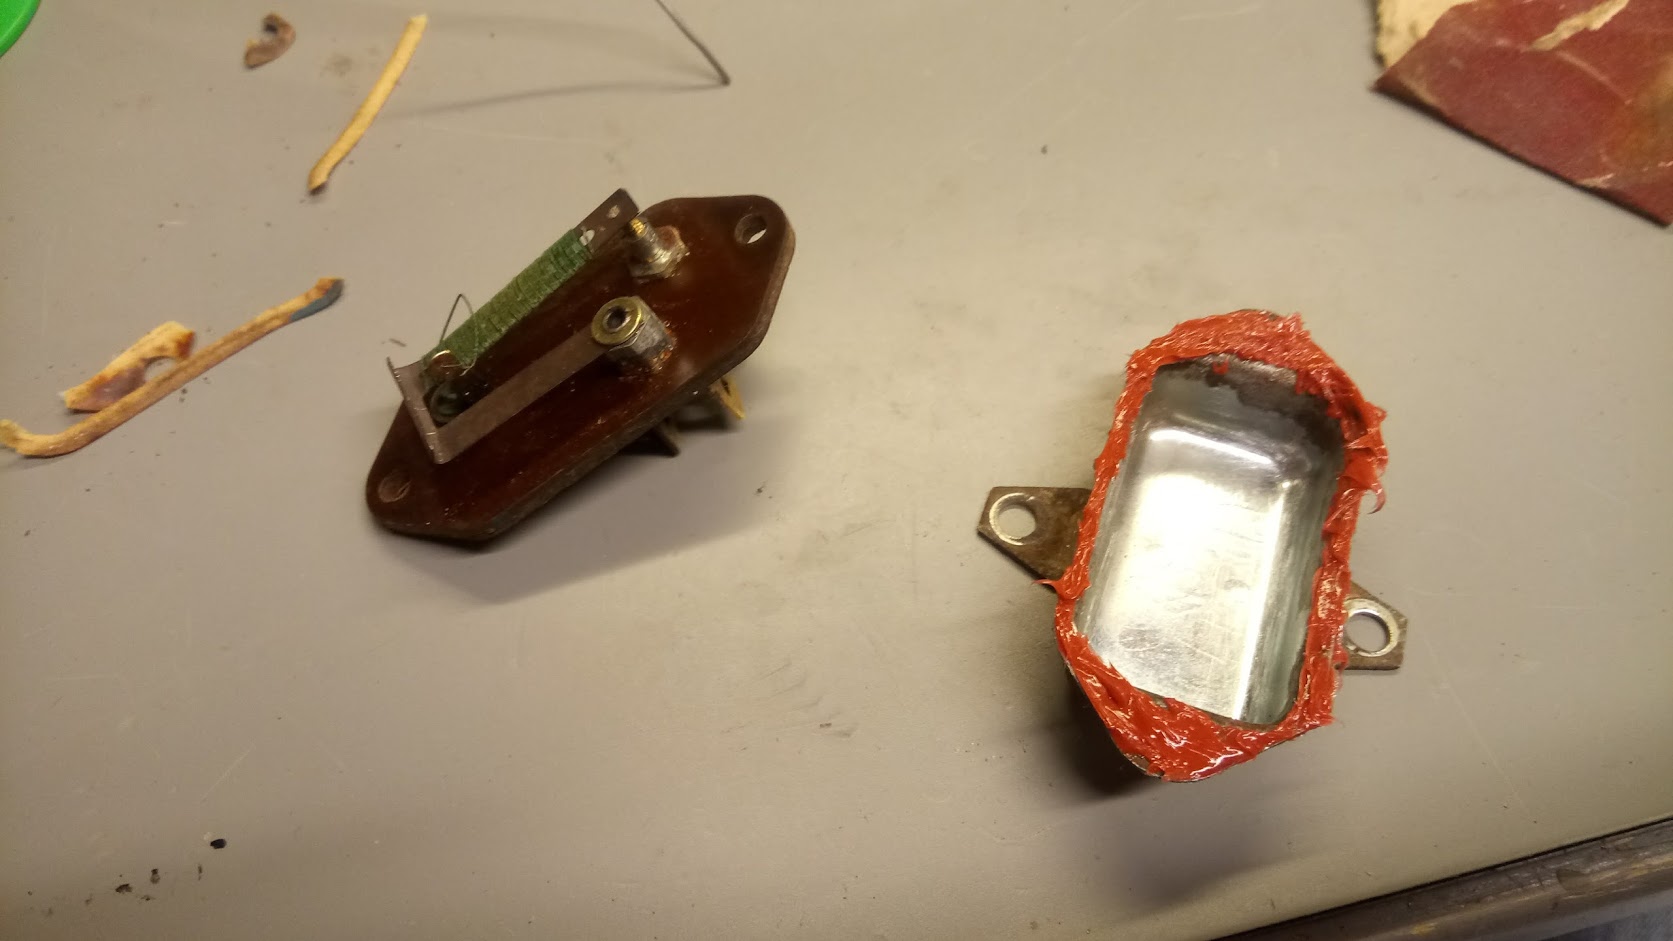
Some time ago we bought a nice used Ford 3000 tractor (3 cylinder diesel, Chief frontloader). It needed some work, and one of the items was a new wiring harness. After replacing all the wiring everything seemed to work fine, until one day all the instruments just died; this being a mechanical beast everything else kept working. After quite some investigation, I found out that the instrument fuse (the only fuse in the entire system) had blown. Replacing it just blew it again, so something was clearly wrong. This lead to taking out the so-called “instrument voltage stabilizer”, and disassembling it.
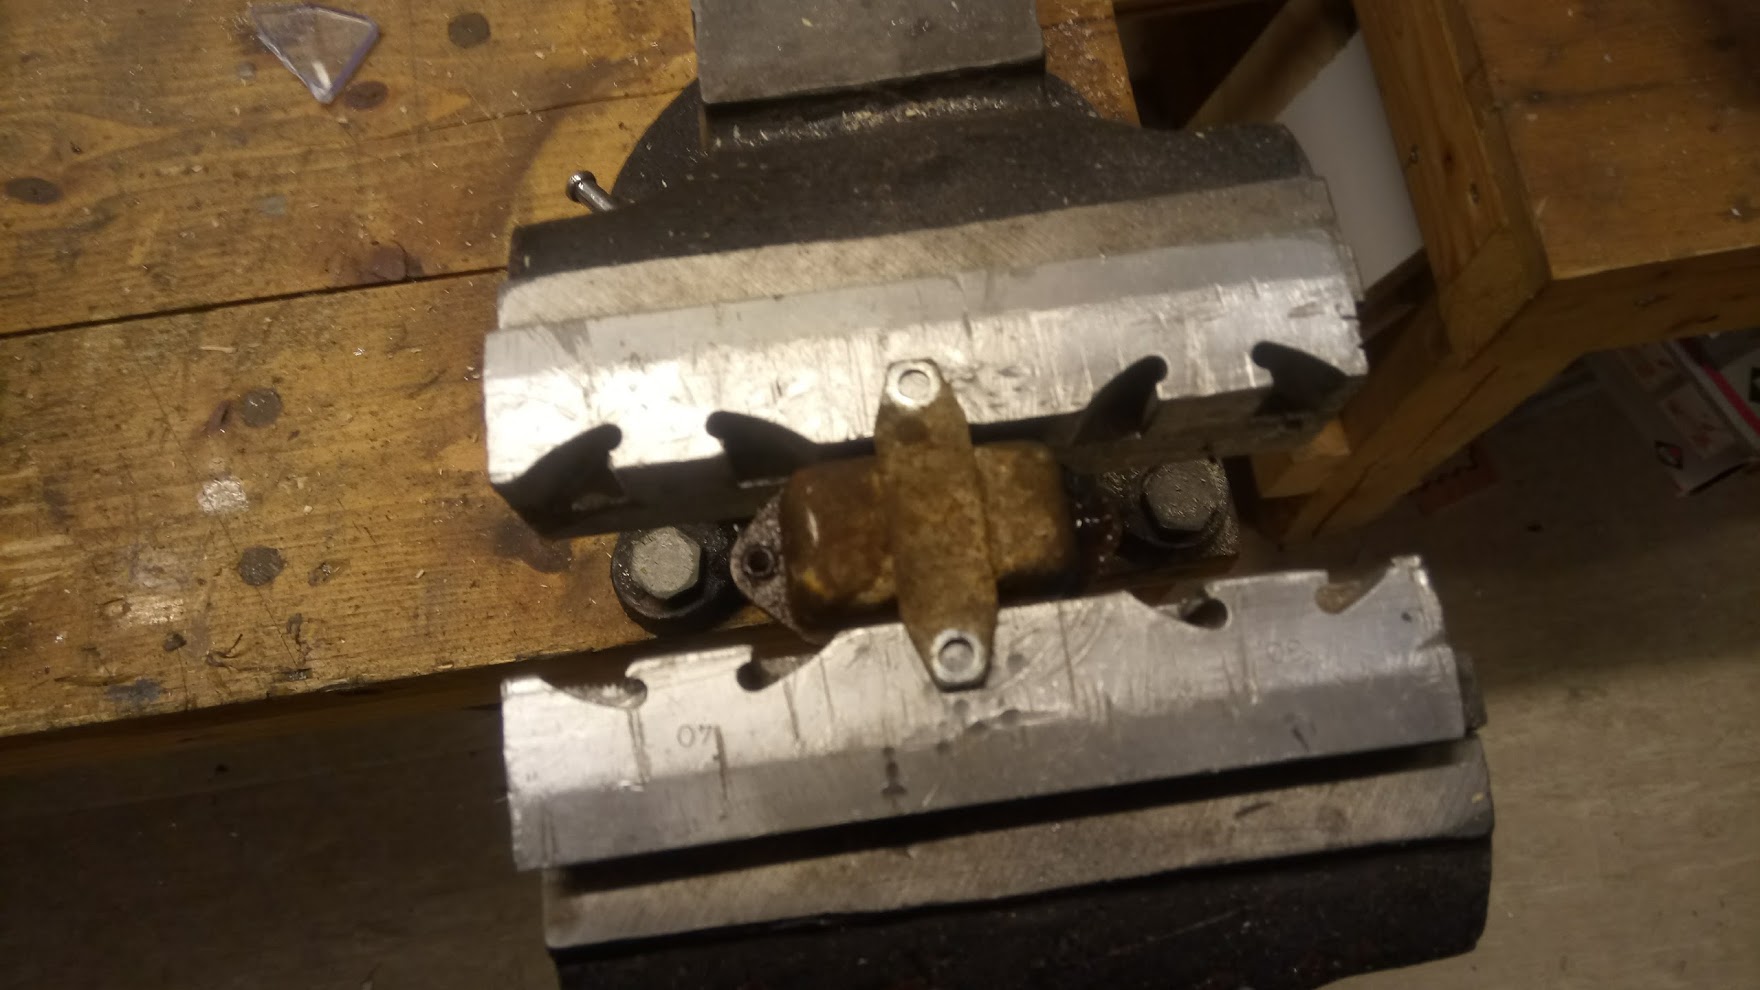
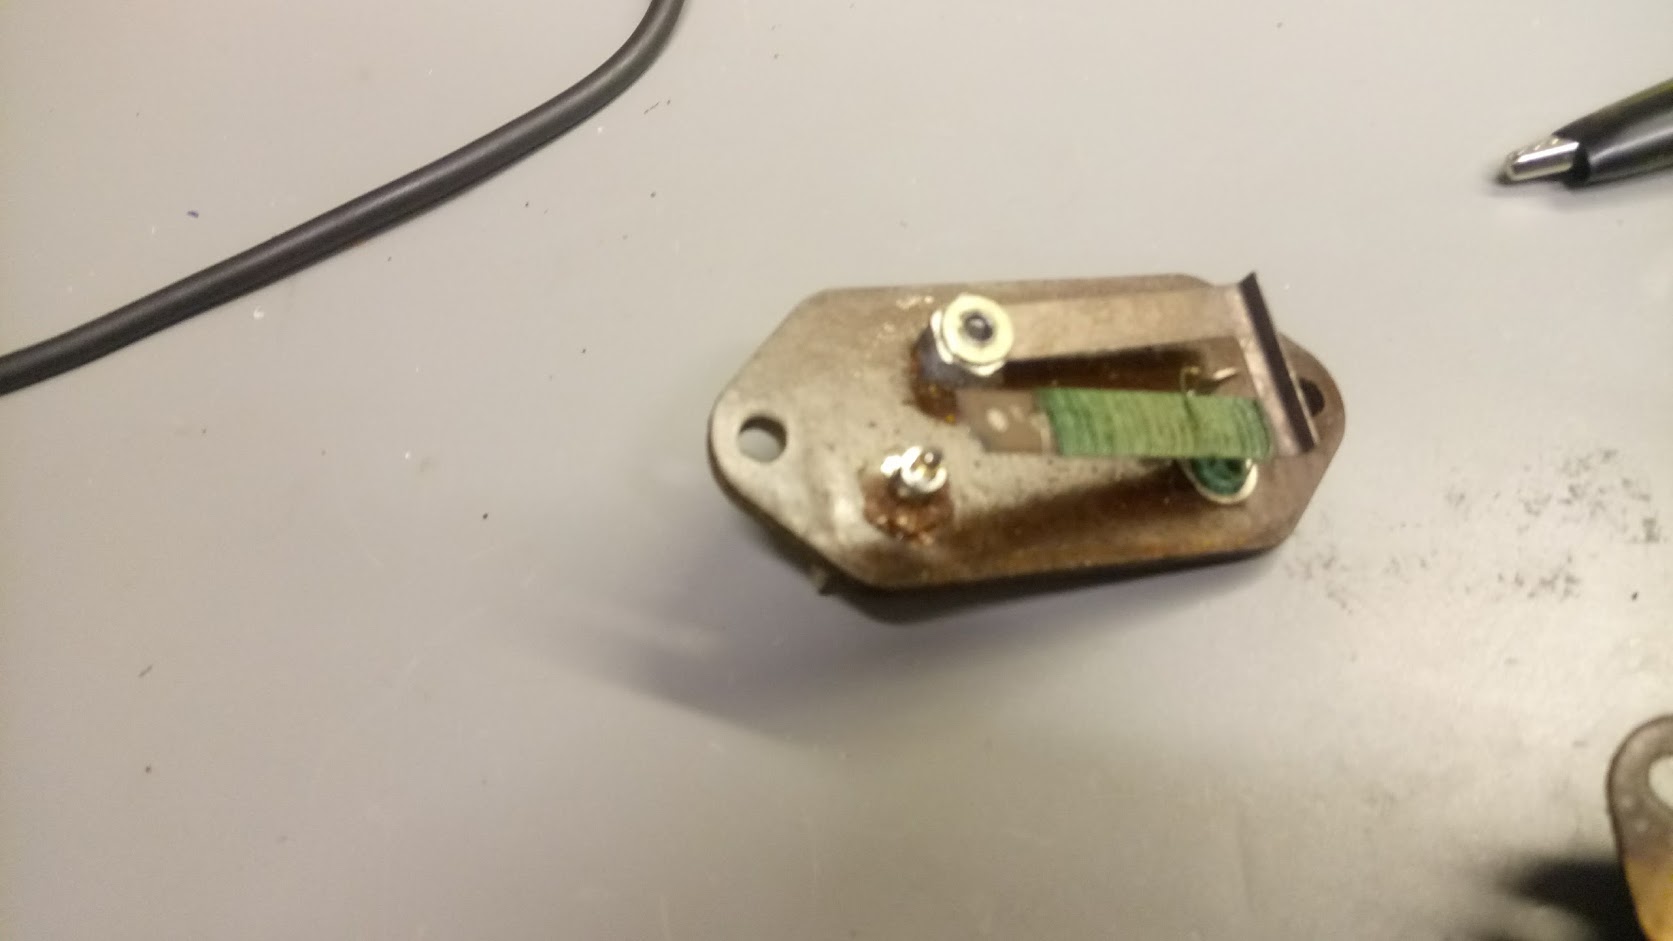
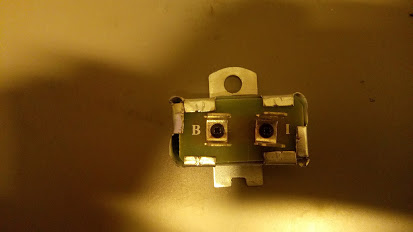
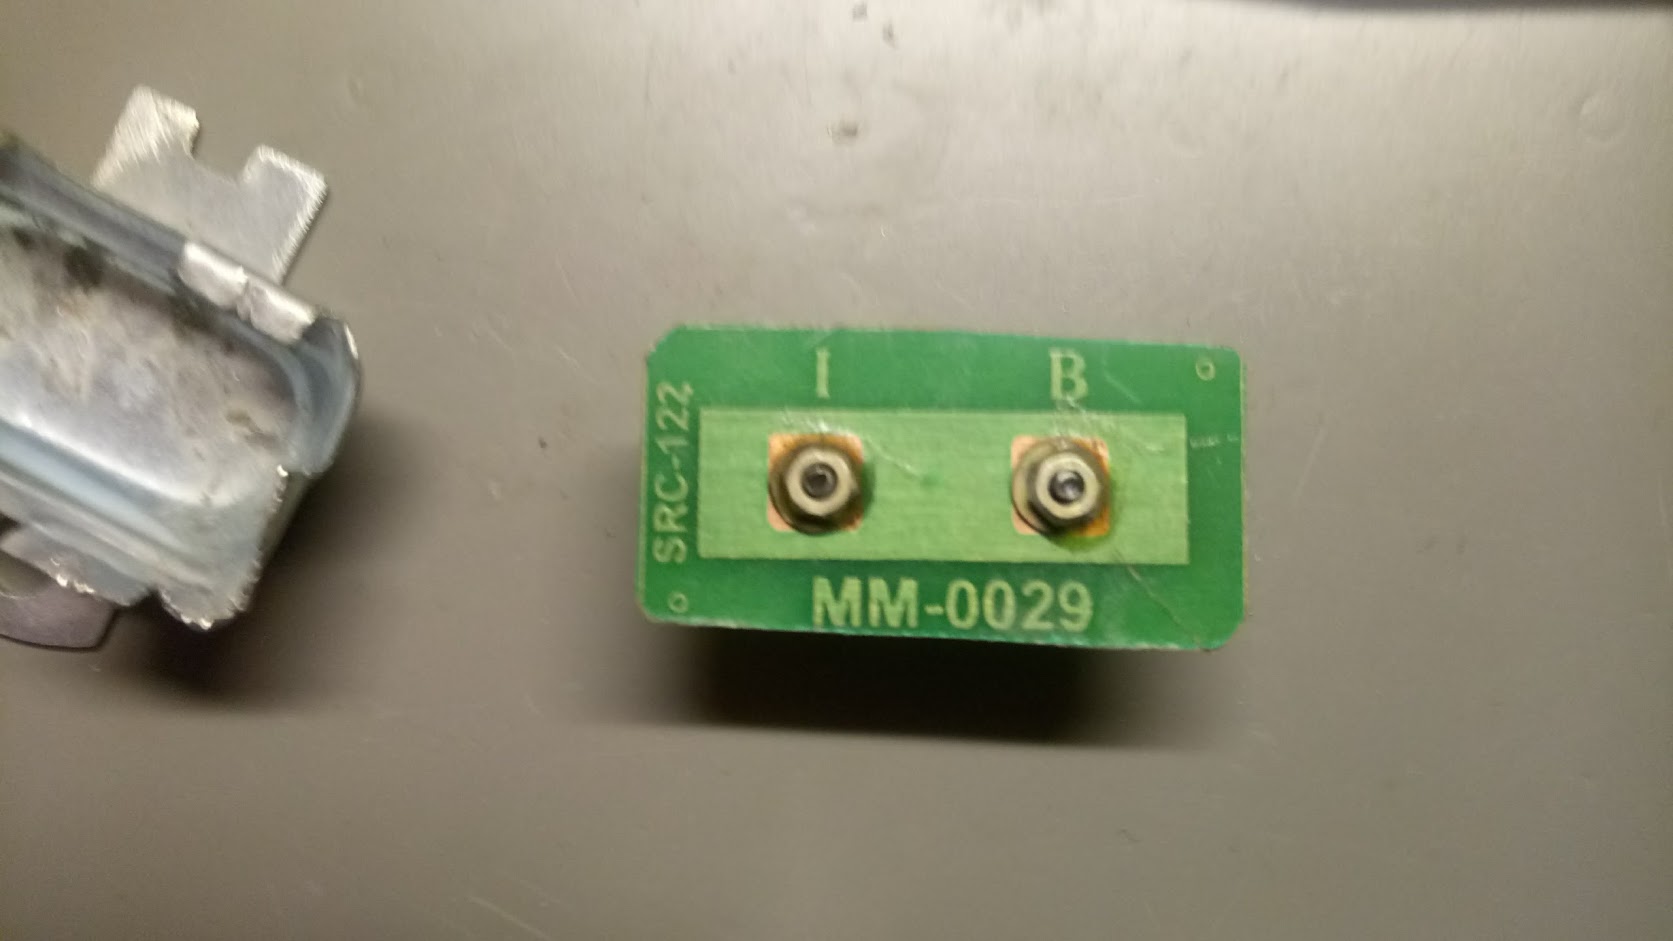
Apparently I had connected it in such a way that the arm had raised itself, and was now short-circuiting to the case. I had already ordered a replacement, but only got what was essentially a very expensive connection:
So, what was the mechanism actually doing, and is it essential? After some headscratching at Hal9k the conclusion was that it was essentially a mechanical PWM, with something like this diagram
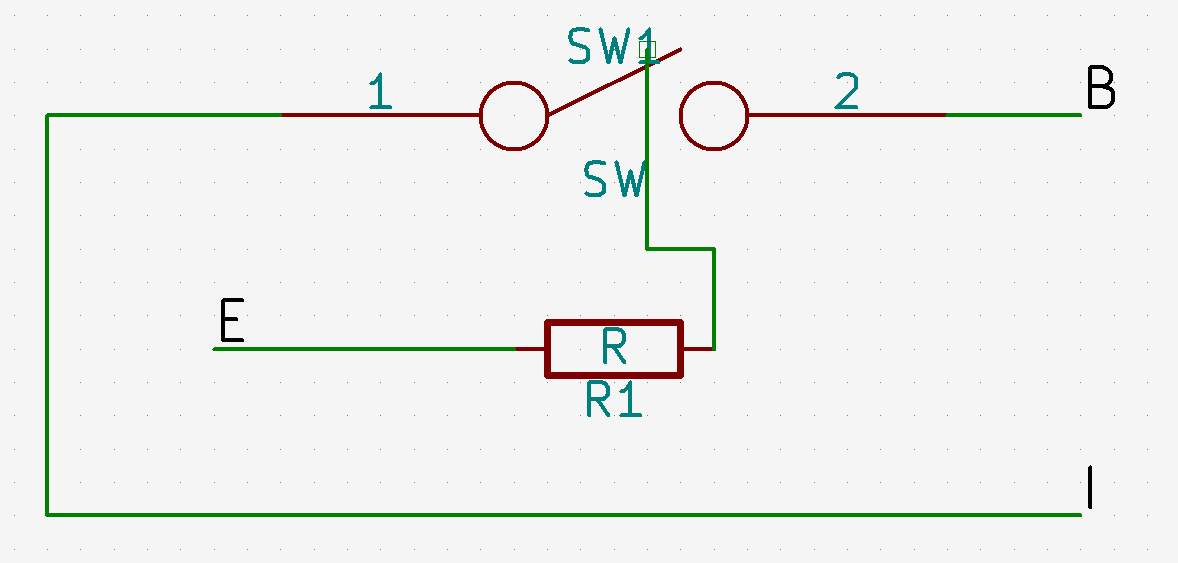
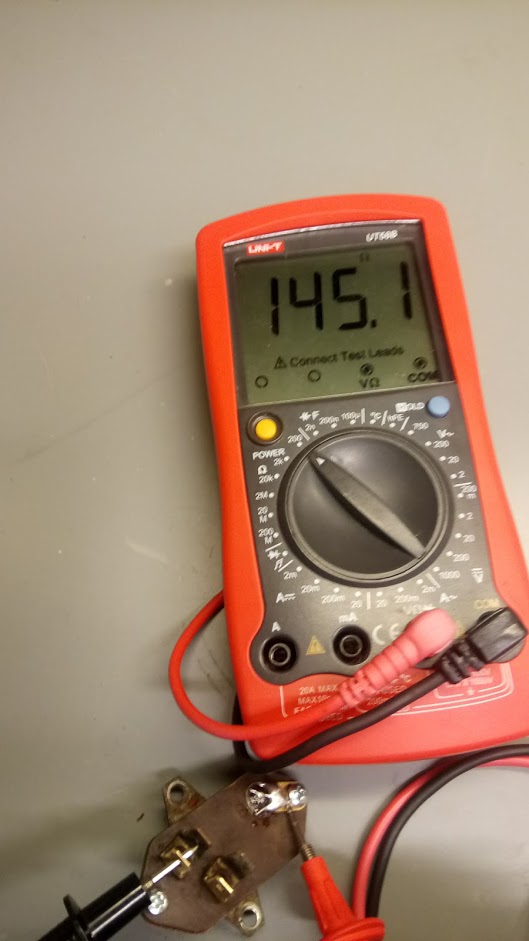
When the switch is touching the terminal current is flowing from the battery (B) to the instruments (I), but also to ground (E) through the resistor wrapped around the switch arm, causing the metal in the switch to heat up and lift. This breaks the connection, whereafter the switch cools down, and at some point makes contact again. Beautifully simple mechanism! Bending the arm back into position essentially fixed the device, and gave this waveform
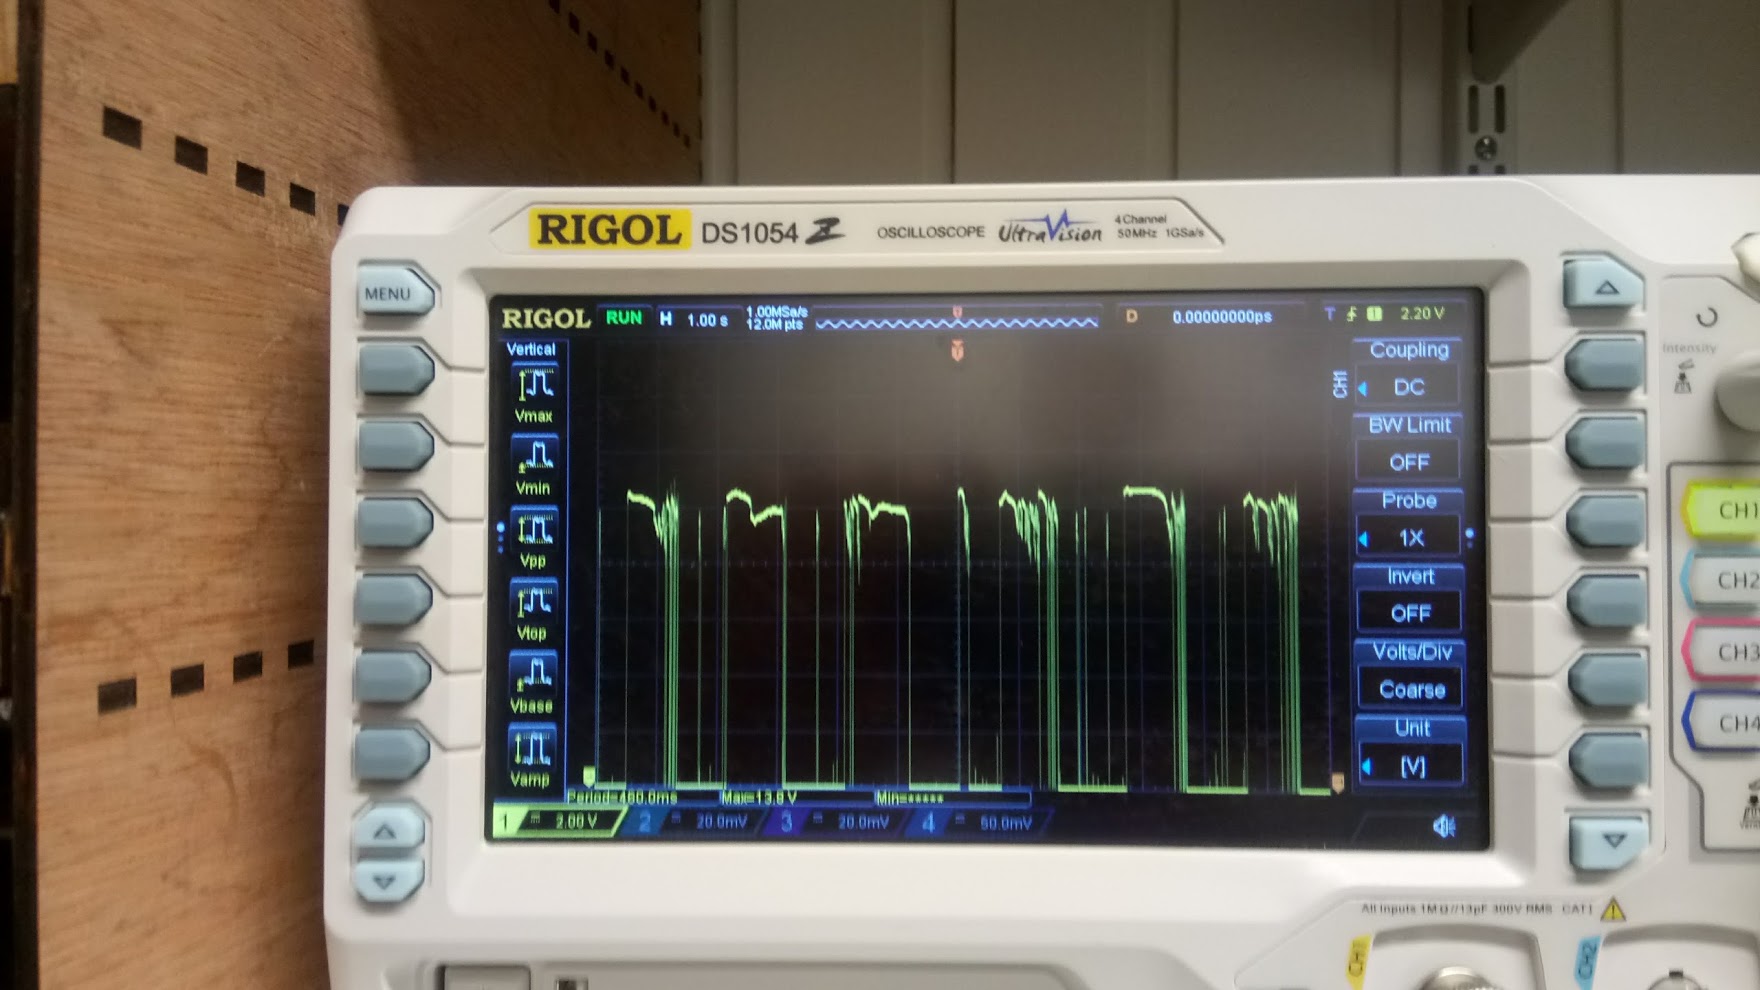
I have seen the function described online as “pulsating DC”, which is actually quite accurate. So, I re-assembled the stabilizer with some sealant, inserted in the instrument cluster of the tractor, and it has worked perfectly ever since.
The only question is why it is done this way, if just giving a constant DC voltage from the battery also seems to work? I haven’t looked into it further, but my best guess is that the instruments are using coils to move the dials slowly, and that the PWM will heat up the coils less. In conclusion: If your voltage “stabilizer” is broken, you can probably do without it, or quite easily repair it.
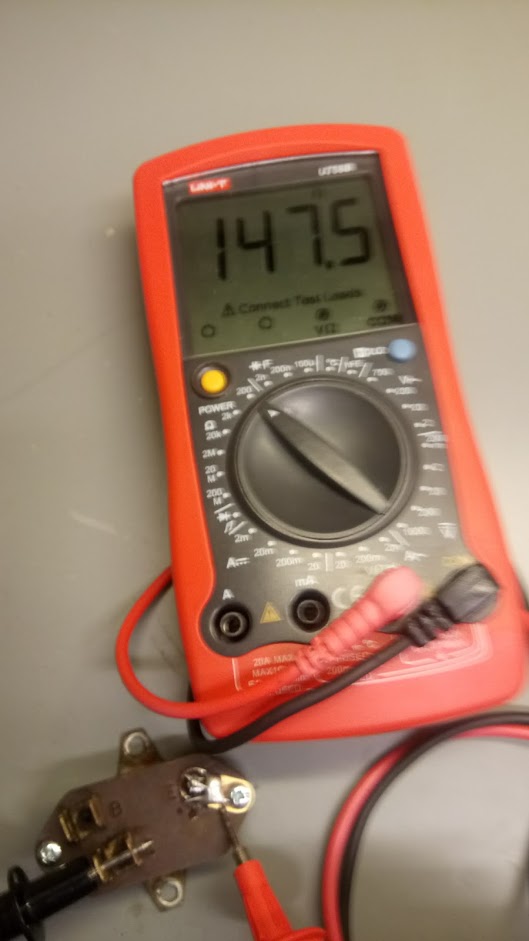
For reference, here are the resistance readings between B-E, and I-E:
Reverse engineering Aduro Smart Response

I have a fancy thermometer for my wood stove namely an Aduro Smart Response. The accompanying Android app basically shows a temperature graph, with guidelines as to whether the burning is optimal and when put in more wood. I have generally been content with the app: it is quite slow, but generally helps in more optimal burning. Recently however, the Android app has stopped working (something about connecting to a database), and this prompted me to start on a project I wanted to do for some time: get the data from the Smart Response unit into a database under my control.
The Smart Response unit uses Bluetooth Low Energy, and is powered by 3xAAA batteries (my batteries lasted for a year before replacing). Connecting to a BLE unit from Linux is quite easy, at least from the command line:
$ sudo hcitool lescan

LE Scan ...

B4:99:4C:25:12:B2 (unknown)

B4:99:4C:25:12:B2 Aduro demo

$ sudo hcitool lecc B4:99:4C:25:12:B2

Connection handle 3585

$ sudo gatttool -b B4:99:4C:25:12:B2 --interactive

[B4:99:4C:25:12:B2][LE]> connect

Attempting to connect to B4:99:4C:25:12:B2

Connection successful
hcitool is used to create a connection/pairing. gatttool is used to query the device interactively. Thereafter the device can be explored, to see which “handles” are available:
[B4:99:4C:25:12:B2][LE]> primary

attr handle: 0x0001, end grp handle: 0x000b uuid: 00001800-0000-1000-8000-00805f9b34fb #Generic Access

attr handle: 0x000c, end grp handle: 0x000f uuid: 00001801-0000-1000-8000-00805f9b34fb #Generic Attribute

attr handle: 0x0010, end grp handle: 0x0022 uuid: 0000180a-0000-1000-8000-00805f9b34fb #Device Information

attr handle: 0x0023, end grp handle: 0x0027 uuid: 0000180f-0000-1000-8000-00805f9b34fb #Battery

attr handle: 0x0028, end grp handle: 0xffff uuid: 0000ffb0-0000-1000-8000-00805f9b34fb # ???
The annotations on the right are mine; the UUIDs can be looked up under GATT services on the Bluetooth website.
For example, the battery status can be queried somewhere in the Battery handle group from 0x0023 to 0x0027:
[B4:99:4C:25:12:B2][LE]> characteristics 0x0023 0x0027

handle: 0x0024, char properties: 0x12, char value handle: 0x0025, uuid: 00002a19-0000-1000-8000-00805f9b34fb

[B4:99:4C:25:12:B2][LE]> char-read-hnd 0x0025

Characteristic value/descriptor: 5d # Battery level 0x5d = 93%
Now, the only unknown primary is from handle 0x0028 and higher. Let’s query those:
[B4:99:4C:25:12:B2][LE]> characteristics 0x0028 0xffff

handle: 0x0029, char properties: 0x0a, char value handle: 0x002a, uuid: 0000ffb6-0000-1000-8000-00805f9b34fb # 0x0a = R/W

handle: 0x002c, char properties: 0x10, char value handle: 0x002d, uuid: 0000ffb7-0000-1000-8000-00805f9b34fb # 0x10 = notify

handle: 0x0030, char properties: 0x10, char value handle: 0x0031, uuid: 0000ffb3-0000-1000-8000-00805f9b34fb # 0x10 = notify

handle: 0x0033, char properties: 0x02, char value handle: 0x0034, uuid: 0000ffb4-0000-1000-8000-00805f9b34fb # 0x02 = Read

handle: 0x0035, char properties: 0x08, char value handle: 0x0036, uuid: 0000ffb8-0000-1000-8000-00805f9b34fb # 0x08 = Write

handle: 0x0037, char properties: 0x08, char value handle: 0x0038, uuid: 0000ffb9-0000-1000-8000-00805f9b34fb # 0x08 = Write

handle: 0x0039, char properties: 0x0a, char value handle: 0x003a, uuid: 0000ffb5-0000-1000-8000-00805f9b34fb # 0x0a = R/W

handle: 0x003b, char properties: 0x08, char value handle: 0x003c, uuid: 0000ffb2-0000-1000-8000-00805f9b34fb # 0x08 = Write
The annotations on the right are again mine: they specify the char properties as looked up under “Characteristic Declaration”. Querying the char value handles gives some uninteresting values (0x00 bytes, etc.), but also some interesting ones:
[B4:99:4C:25:12:B2][LE]> char-read-hnd 0x002d

Characteristic value/descriptor: c4 01 03 01 fd 00

[B4:99:4C:25:12:B2][LE]> char-read-hnd 0x003a

Characteristic value/descriptor: 44 65 6d 6f 20 20 20 00 # 'Demo \x00'

[B4:99:4C:25:12:B2][LE]> char-read-hnd 0x0034

Characteristic value/descriptor: c3 01 ba 01 c4 01 27 00 c2 01 d1 01
Querying a bit outside also gives some very interesting strings:
[B4:99:4C:25:12:B2][LE]> char-read-hnd 0x002b

Characteristic value/descriptor: 41 64 75 72 6f 20 47 65 74 4c 6f 67 # 'Aduro GetLog'

[B4:99:4C:25:12:B2][LE]> char-read-hnd 0x002f

Characteristic value/descriptor: 41 64 75 72 6f 20 4c 69 76 65 56 61 6c 75 65 # 'Aduro LiveValue'
At this point I tried to look for values that changed, and also manipulating the device (temperature, playing with the damper that is connected with a microswitch). It turns out that 0x002d and 0x0034 changes values, but 0x002d changes the most. Is there a pattern?
Characteristic value/descriptor: c4 01 08 01 fb 00

[B4:99:4C:25:12:B2][LE]> char-read-hnd 0x002d

Characteristic value/descriptor: c4 01 1f 01 f3 00

[B4:99:4C:25:12:B2][LE]> char-read-hnd 0x002d

Characteristic value/descriptor: c4 01 3c 01 ec 00

[B4:99:4C:25:12:B2][LE]> char-read-hnd 0x002d

Characteristic value/descriptor: c4 01 5c 01 e2 00

[B4:99:4C:25:12:B2][LE]> char-read-hnd 0x002d

Characteristic value/descriptor: c4 01 9f 01 c3 00

[B4:99:4C:25:12:B2][LE]> char-read-hnd 0x002d

Characteristic value/descriptor: c4 01 0f 02 9d 00

#counting UP DOWN
Something is counting up, while something else seems to be counting down; this was while the temperature was cooling down. As 0x002d allows for notify, we can even ask for notifications by writing 0x0100 to 0x002d + 1:
[B4:99:4C:25:12:B2][LE]> char-write-cmd 0x002e 0100

Notification handle = 0x002d value: c5 01 43 00 2a 01

Notification handle = 0x002d value: c5 01 44 00 2a 01

Notification handle = 0x002d value: c5 01 45 00 2b 01

Notification handle = 0x002d value: c5 01 46 00 2c 01

...

Notification handle = 0x002d value: c5 01 f0 01 94 00

Notification handle = 0x002d value: c5 01 f1 01 94 00

Notification handle = 0x002d value: c6 01 00 00 93 00

Notification handle = 0x002d value: c6 01 01 00 93 00
In the end of the series I manipulated the damper. Trying to identify the temperature, the last 2 characters seems the most promising: values from 0x93 (147 C) to 0x012c (300 C) seem reasonable from what I have seen previously. The middle 2 characters always increase by 1, so it is probably a datapoint counter. The first 2 characters seems to increase by using the damper.
This was implemented in a small Python script, using the library Gattlib, pyAduroSmart.py.
I hooked this into my home monitoring system (more on that in a later blog post), and now have a nice graph of the number of firings, and the temperature: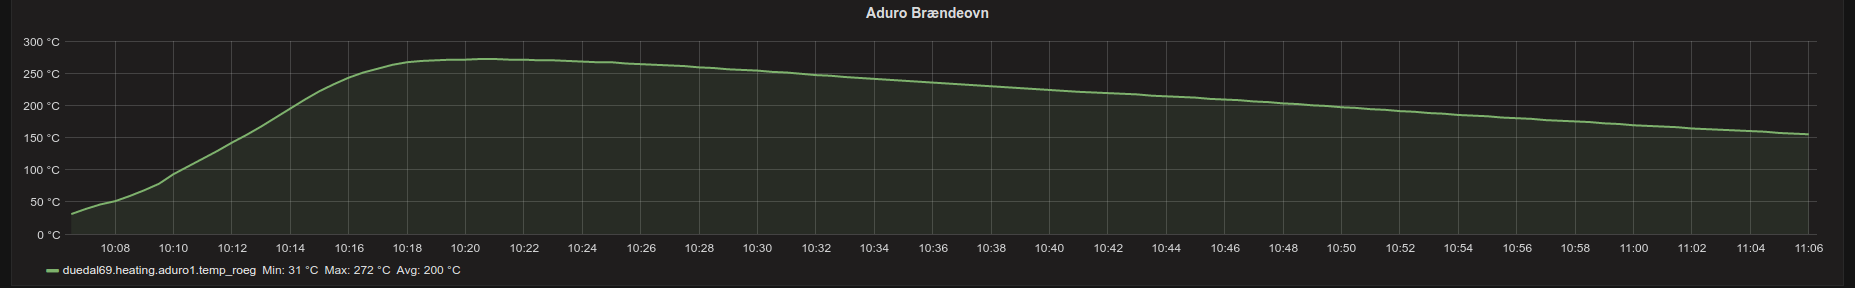
Update 26/11-2022:
Gattlib seems to be more or less obsolete and not ported to Python3, so I had to port my script to Bleak. There were some stability problems, especially around not being notified about disconnects from the device, and if not explicitly disconnecting before exiting the script it is not possible to reconnect without restarting the bluetooth service. The updated script can be found here py3AduroSmart.py.